1.What information is avaiable in the SEdb 3.0?
Super-enhancers are a large cluster of transcriptionally active enhancers enriched in enhancer-associated chromatin characteristics. Compared to typical enhancers, super-enhancers are larger, exhibit higher transcription factor density, and are frequently associated with key lineage-specific genes that control cell state and differentiation in somatic cells.
Here, we developed a comprehensive super-enhancer database across multiple species (SEdb 3.0, http://www.licpathway.net/sedb), which aims to provide a large number of available resources on human, mouse, Arabidopsis thaliana and maize super-enhancers. The potential functions of super-enhancers in the regulatory network are also annotated in the database. The current version of SEdb 3.0 has recorded a total of 3,478,186 SEs from 5,387 samples, including 3,389 human samples, 1,962 mouse samples, 21 Arabidopsis thaliana samples and 15 maize samples. Furthermore, SEdb 3.0 also provides detailed genetic and epigenetic annotation information on super-enhancers. The information includes common SNPs, motif changes, expression quantitative trait loci (eQTL), risk SNPs, transcription factor binding sites (TFBSs), CRISPR/Cas9 targets, DNase I hypersensitive sites (DHSs), chromatin accessibility regions, methylation sites, chromatin interaction regions, TADs and eRNAs. For the in-depth analysis of super-enhancers, SEdb 3.0 will help clarify the functions related to super-enhancers and discover potential biological effects.
2.What samples are included in the SEdb 3.0?
The current version of SEdb 3.0 documented 3,478,186 SEs from 5,387 samples, including 1,739 original human samples, 931 original mouse samples, 1,650 newly released human samples, 1,031 newly released mouse samples, 21 Arabidopsis thaliana samples and 15 maize samples, including the samples from NCBI GEO/SRA, ENCODE, Roadmap, GGR and NGDC GSA. For all samples, super-enhancers were identified by using a unified system environment and software parameters.
For more detailed statistics, please see the "Statistics" page.
3.Database Content and Construction
SEdb 3.0 calculated super-enhancers based on H3K27ac ChIP-seq data. Genetic and epigenetic annotations were collected or calculated including common SNPs, motif changes, expression quantitative trait locus (eQTL), risk SNPs, transcription factor binding sites (TFBSs), CRISPR/Cas9 target sites,DNase I hypersensitivity sites (DHSs),chromatin accessibility regions, methylation sites, chromatin interactions regions, TADs and eRNAs. Users query super-enhancers using four types: tissue-category-based query, gene-based query, genomic-region-based query and TF-based query. SEdb 3.0 includes analytical tools and personalized genome browser to discover potential biological effects of super-enhancers.
4.How to use the SEdb 3.0?
4.1:Data-Browse
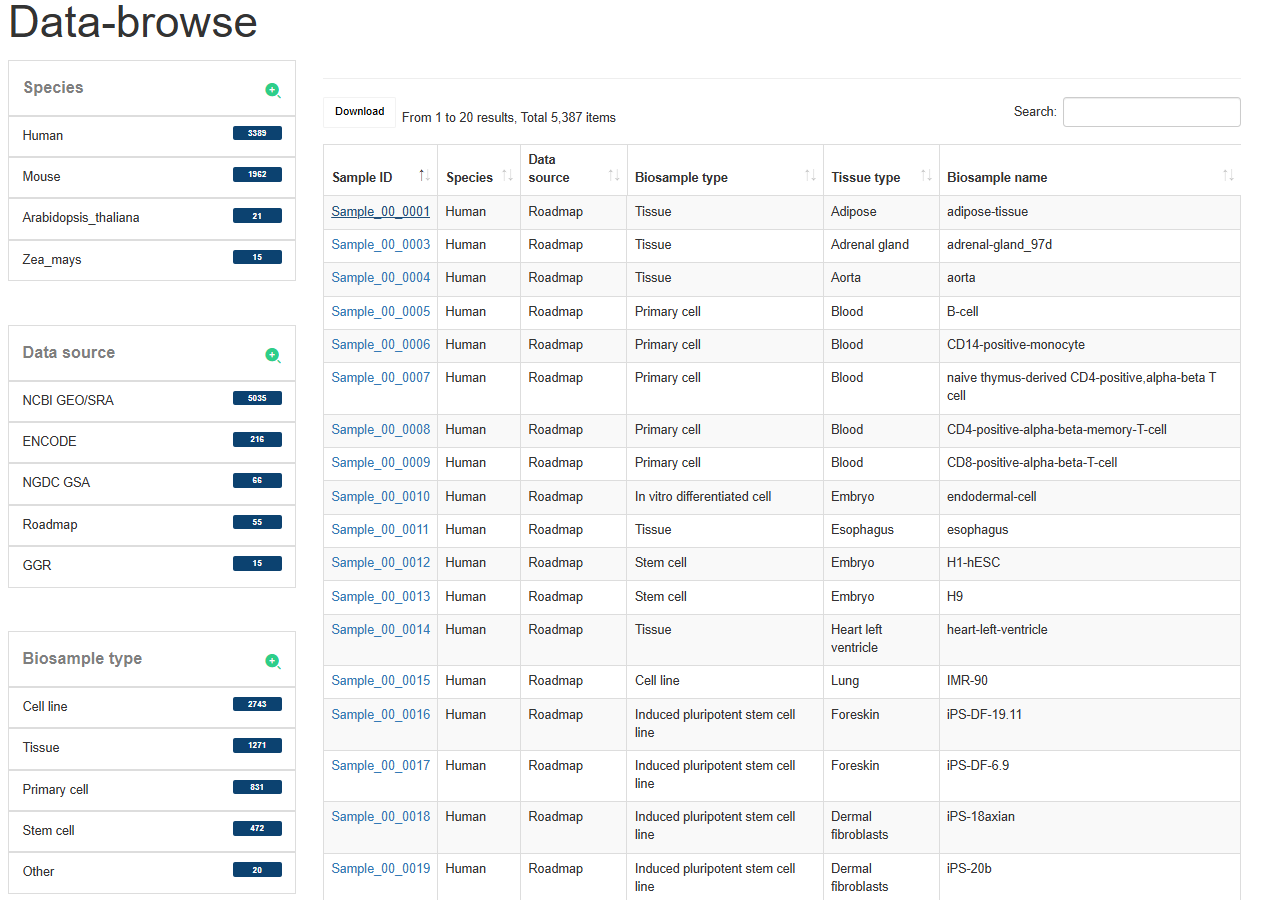
The 'Data-Browse' page is an interactive table of alphanumeric sorting that allows you to quickly search for samples and customize filters through 'Species', 'Data sources', 'Biosample type' and 'Tissue type'. Users can use the ‘Show entries’ drop-down menu to change the number of records per page. To view the super-enhancer for a given sample, users only need to click on the ‘Sample ID’ to view it.
4.2:Search
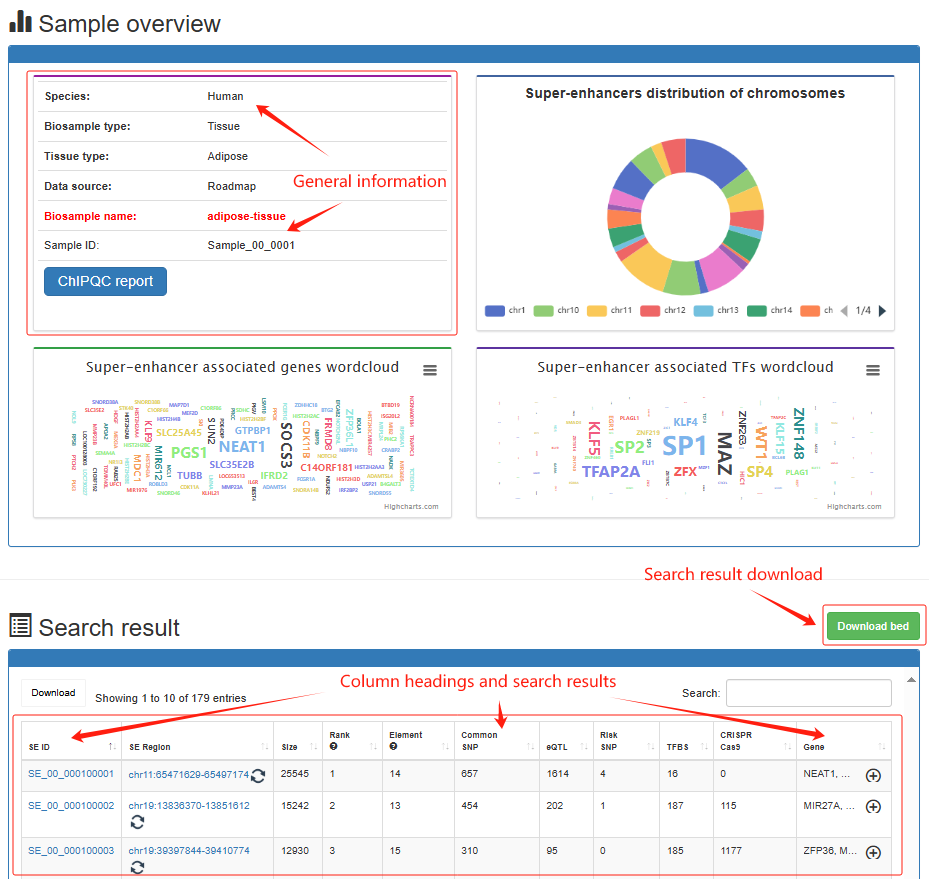
Super-enhancer search result Users determine the scope of the super-enhancer query by determining the sample and genome location for the results of interest. Brief information on the search results is displayed in a table on the results page. Users can click Search→Human→Tissue→Adipose→adipose-tissue, the search results will be displayed on the next page. The 'Super-enhancer search result' page, include sample overview, search parameters, pie charts for the number of chromosomes distributed by super-enhancer, wordcloud of super-enhancer associated TF/gene, ChIPQC report, super-enhancer annotation visualization, search results table, sample file usage, annotation information usage and software parameters used.
Super-enhancer detail
Users can click 'SE_00_000100001', the super-enhancer detail information will be displayed on the next page.
Super-enhancer overview
Overview information includes SE ID, Data source, Biosample type, Tissue type, Biosample name, genome location, Size, Super-enhancer Rank, ChIP Density (Case), ChIP Density (input) and Genome Browser.

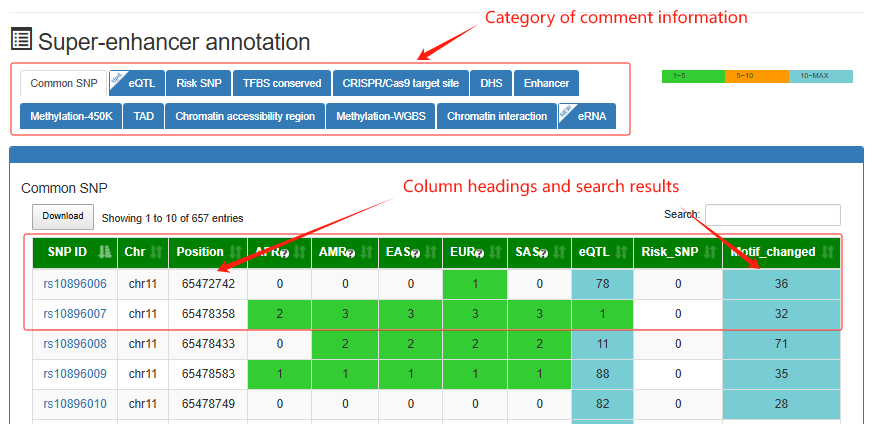
Super-enhancer annotation
This is a detailed display of the 'SE_00_000100001' annotation.
Super-enhancer associated genes
This is a detailed display of the 'SE_00_000100001' associated genes.

TF/TcoF/CR Binding to Super-enhancer
This is a detailed display of the 'SE_00_000100001' associated TFs/TcoFs/CRs.

Super-enhancer element (H3K27ac)
This is a detailed display of the 'SE_00_000100001' elements.

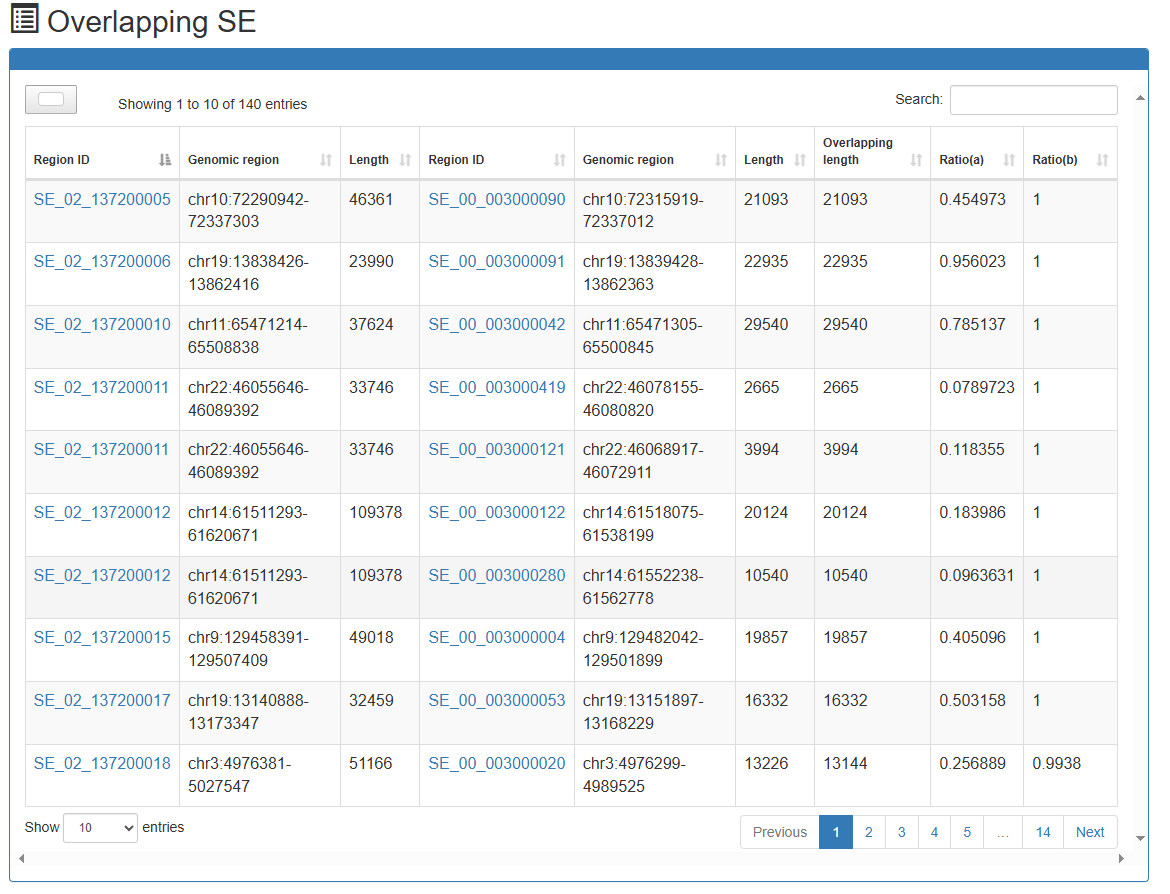
Overlap with other super-enhancers
Links to other super-enhancers identified in different samples which overlap with 'SE_00_000100001'.

Super-enhancer element detail
Users can click 'Detail', the Super-enhancer element detail information will be displayed on the next page.
Super-enhancer element overview

4.3:Analysis
Gene-SE Analysis: Batch analysis of Gene-Super-enhancer
Users can submit a gene and search super-enhancers associated with it via relationships under different strategies (Eight strategies:The closest active, ROSE overlap, ROSE proximal, ROSE closest, Lasso, PreSTIGE, BETA, ABC) are obtained from determined samples.
Users can submit a gene list and choose the species (human or mouse or Arabidopsis or maize), the gene's analysis results will be displayed on the next page.


SNP-SE Analysis: Analyze common SNP in the Super-enhancer regions
Users can submit a common SNP and find the super-enhancers it falls into, the corresponding super-enhancers related annotation information and LD SNPs of five population.
The motif changed is calculated using the R package 'atSNP'. The linkage disequilibrium SNPs is calculated using the Phase 3 of the 1000 Genomes Project.
Users can click SNP-SE analysis→rs4881215, the SNP's analysis results will be displayed on the next page.

Overlap Analysis
Users can submit a bed file and identify super-enhancers that has an overlap relationship with the submitted regions in the bed file through setting the percentage of overlap.

Differential-overlapping-SE Analysis
Users can submit two 'Biosample names' of interest and select species of interest (human or mouse or Arabidopsis or maize). SEdb 3.0 uses BEDTools to compare reference genome locations to online analyze differential and overlapped SEs between the two submitted samples. In the result page, SEdb 3.0 can display detailed SE information, such as differential and overlapped SE regions, region length, overlapping ratio and SE associated genes. At the same time, two buttons (Gene Ontology enrichment and KEGG pathway enrichment) are provided for each sample to realize online enrichment analysis of specific SE associated genes using clusterProfile package in the current sample.


SE-based TF-GENE Analysis
Users submit two lists of TF and gene and select species of interest, SEdb 3.0 identifies SE-mediated TF-gene pair(s) in different tissue types. Meanwhile, the users can set different statistical thresholds through the 'FIMO' option. Numbers, genomic regions, and sample information of TF-gene pair(s) associated SEs can be displayed.


SE blast alignment analysis
Users can input a genomic sequence or upload a sequence file. SEdb 3.0 will perform sequence alignment against the SE database using BLAST and retrieve the most similar super-enhancer.


SE-driven core TF enrichment analysis
Users can input a gene list or upload a gene list file. This SE-driven core TF enrichment module helps identify TFs that may act as key regulators of SE-mediated transcription programs in the input gene set. By specifying a sample ID, the module maps each gene to its associated SEs in the selected sample and performs enrichment analysis to identify TFs significantly enriched through SE-mediated regulation.


4.4:Genome-Browser
To help users view proximity information of super-enhancers in genomes, we developed a personalized genome browser using JBrowse with useful tracks. Current genome browsers contained multiple reference genomes per species, including human (Hg38 and Hg19) , mouse (Mm10 and Mm39), Arabidopsis thaliana (TAIR10) and Maize (B73). Hg38 and Mm10 are displayed as default reference genomes in human and mouse. Users see the proximity of super-enhancers to nearby genes, genome segments, SNPs, common SNPs, risk SNPs, DHSs, enhancers, TFBS conserved, TFBS by ChIP-seq data and TADs.

4.5:Download
SEdb 3.0 provided multiple reference genomes, including Hg19, Hg38, Mm10, Mm39, TAIR10 and B73 of SEs, typical enhancers and SE elements of all samples for download on the ‘Download’ page. Moreover, the genetic and epigenetic annotations are also provided for download, such as common SNPs, risk SNPs, eQTLs, TADs, DHSs and so on.

5.CGI interface (Overlap with the user-submitted genome location)
In the aspect of data sharing, a CGI program was specially built for SEdb 3.0. Users, especially website developers only needs to provide the location region of the genome and use the link of the SEdb 3.0 website to determine which Super-enhancers overlap with the region. The data obtained by the feedback can be displayed directly on the platform.
Users can use 'iframe' to get feedback and display super-enhancer data on their platform.
Instructions: http://www.licpathway.net/sedb/search/overlap_cgi.php?chr=(Chromosome number)&start=(Genome start position)&end=(Genome end position)&species=(Human or Mouse)
For Example: http://www.licpathway.net/sedb/search/overlap_cgi.php?chr=chr18&start=3592913&end=3627821&species=Human

6.Explanation of the definitions used by the website
SE: super-enhancer
GGR: Genomics of Gene Regulation Project
DHS score: Indicates how dark the peak will be displayed
‘Important’ in the context of SE locations: To highlight the importance of this information, we added the label "important" after the super-enhancer's genomic location.
Super-enhancer element: The enhancer who constitutes super-enhancer, that are constituents of the super-enhancer
Data sources: Sources of sample, including NCBI GEO/SRA, ENCODE, Roadmap, GGR and NGDC GSA.
Biosample type: Cell type classification of samples.
Tissue type: Samples tissue type.
Biosample name: Biosample name is made of cell/tissue/cell line name, treatment condition, processing time, etc.
Chromosome: Chromosome.
Start position: The super-enhancer is at the start of the chromosome.
End position: The super-enhancer is at the end of the chromosome.
External links: Link to an external database for more information
Overlap rate: The overlap ratio between a certain super-enhancer regions and all super-enhancer regions.
Rank: The rank of SE is calculated based on H3k27ac density in the sample
7.Frequently Asked Questions
7.1:Why is some information fruitless?
Reply:It may be because there is no corresponding annotation for the sample or the region has no result.
7.2:Why might web pages load slowly?
Reply:SEdb 3.0 has advanced storage technology and sufficient bandwidth to meet the needs of most users for the speed of web page loading. However, it is not excluded that few users have poor user experience due to network reasons.
7.3:The database integrates H3K27ac ChIP-Seq, input control sequencing, and DNA hypersensitivity data, but it is not clear how these datasets are matched for each cell type. Were only samples with all three data types considered?
Reply:To ensure the quality of super-enhancer identification, each of the H3k27ac samples collected by SEdb 3.0 need to contain H3K27ac ChIP-seq and the corresponding input control sequencing data. Furthermore, a sample, as well as cell type, will be contained in the database if super-enhancers were successfully identified in the sample using H3K27ac ChIP-seq and the corresponding input control sequencing. DNA hypersensitivity data are only used to annotate the identified super-enhancers. We match corresponding DNA hypersensitivity data to super-enhancers of a sample/cell type in the database if DNA hypersensitivity data exist for that sample/cell type.
7.4:How is the sample repetition removed?e.g. ENCODE samples contained within GEO/SRA.
Reply:Data in SEdb 3.0 come from ENCODE, Roadmap, GGR, and GEO/SRA. We first downloaded the data for ENCODE, Roadmap, and GGR from the ENCODE/Roadmap website (www.encodeproject.org/). These data have already been de-duplicated on the website. In the process of screening NCBI GEO/SRA data, we did not consider samples that appeared in ENCODE, Roadmap, or GGR. Finally, all data from ENCODE, Roadmap, GGR, and GEO/SRA were further de-duplicated manually according to the unique GEO/SRA series number.
8.Development environment
Development environment
The current version of SEdb 3.0 was developed using MySQL 5.7.17 (http://www.mysql.com) and runs on a Linux-based Apache Web server (http://www.apache.org). We used PHP 7.0 (http://www.php.net) for server-side scripting. We designed and built the interactive interface using Bootstrap v3.3.7 (https://v3.bootcss.com) and JQuery v2.1.1 (http://jquery. com). We used ECharts (http://echarts.baidu.com) and D3 (https://d3js.org) as a graphical visualization framework, and JBrowse (http://jbrowse.org) is the genome browser framework. We recommend using a modern web browser that supports the HTML5 standard such as Firefox, Google Chrome, Safari, Opera or IE 9.0+ for the best display.
The SEdb 3.0 database is freely available to the research community using the web link (http://www.licpathway.net/sedb). Users are not required to register or login to access features in the database.
Material disclaimer
The materials and frameworks used by SEdb 3.0 are shared by the network and do not contain intellectual property infringement. If there is any infringement, please write to us and we will change it in time.