1.Introduction.
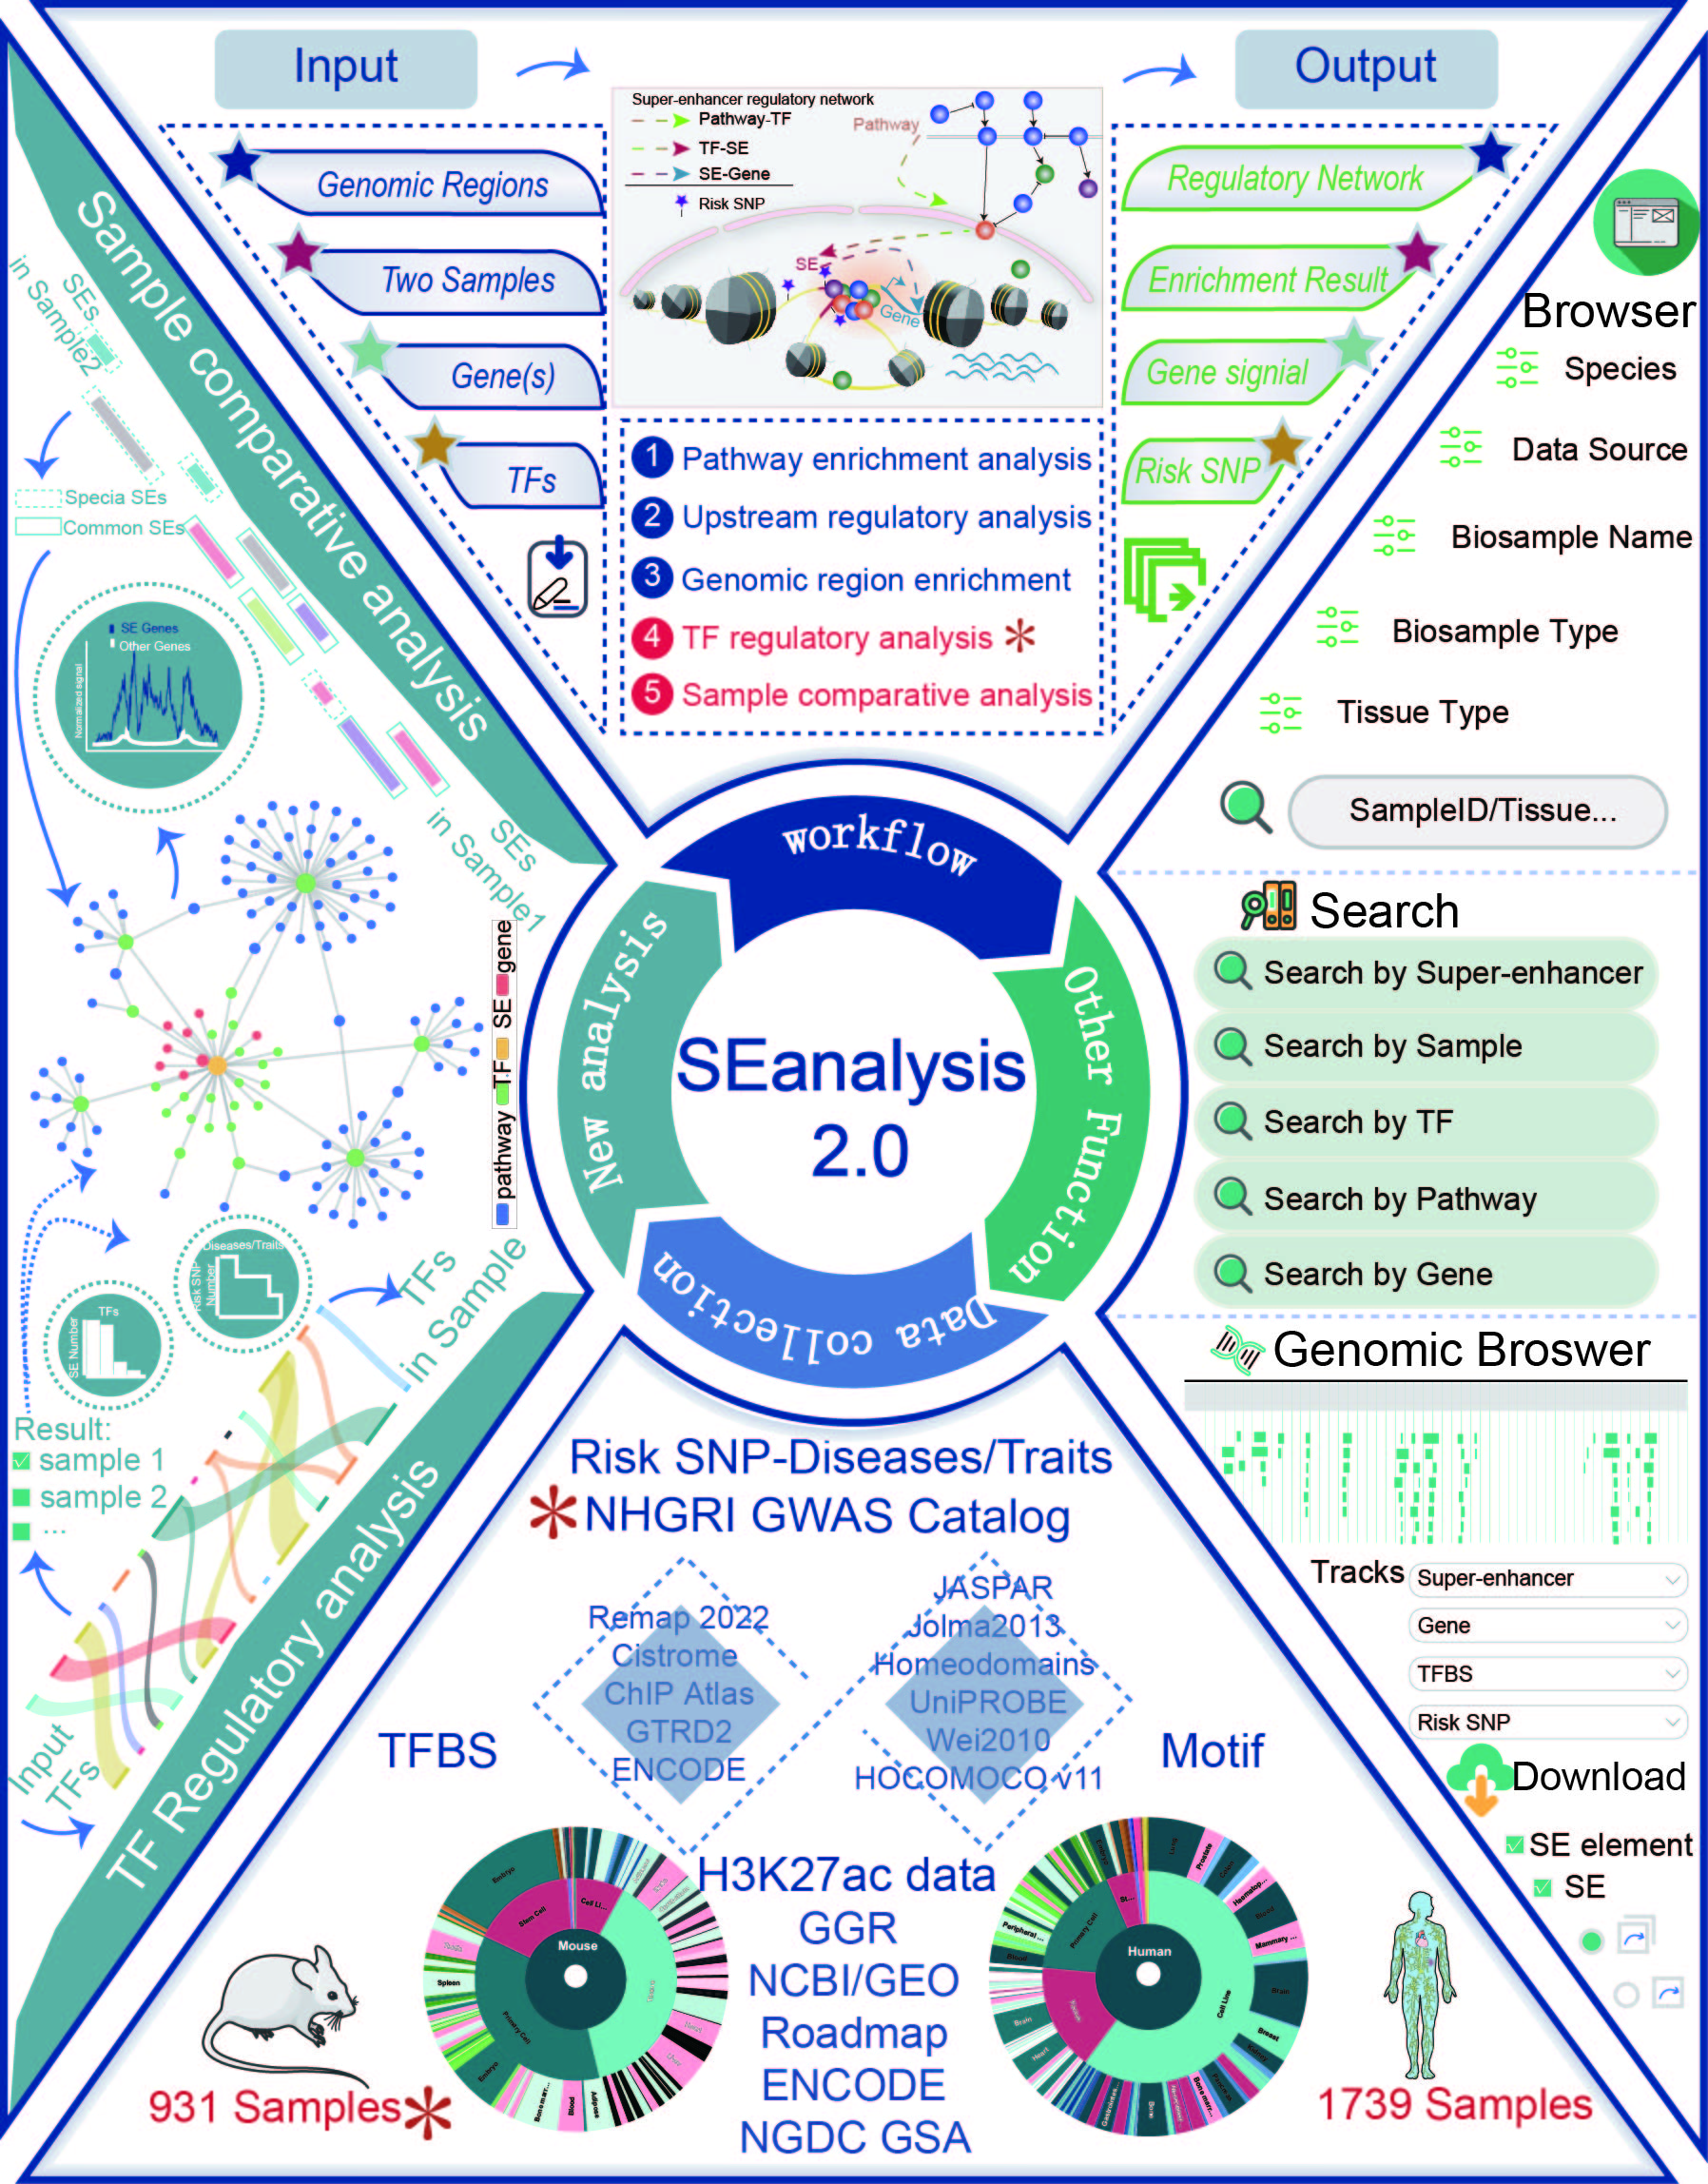
We designed a novel web server, SEanalysis, which provides comprehensive SE-associated regulatory network analyses. SEanalysis characterizes SE-associated genes, TFs binding to target SEs, and their upstream pathways.
Users can perform the following SE-associated network analysis in the web server: I. Pathway downstream analysis. II. Upstream regulatory analysis. III. Genomic region annotation. The current version of SEanalysis contains more than 330,000 SEs from more than 540 types of cells/tissues, 5,042 TF ChIP-seq data generated from these cells/tissues, DNA-binding sequence motifs for ~700 human TFs and 2,880 pathways from 10 databases. SEanalysis supports searching by either SEs, samples, TFs, pathways or genes. The complex regulatory networks formed by these factors can be interactively visualized. In addition, we developed a customizable genome browser containing more than 6,000 customizable tracks for visualization.
2.How to use the "Analysis"?
This webtool provides five different SE-associated network analyses: "TF regulatory analysis", "Sample Comparative analysis", "Pathway downstream analysis", "Upstream regulatory analysis" and "Genomic region annotation".
2.1.Pathway downstream analysis
URL: http://licpathway.net/SEanalysis/analysisone.do
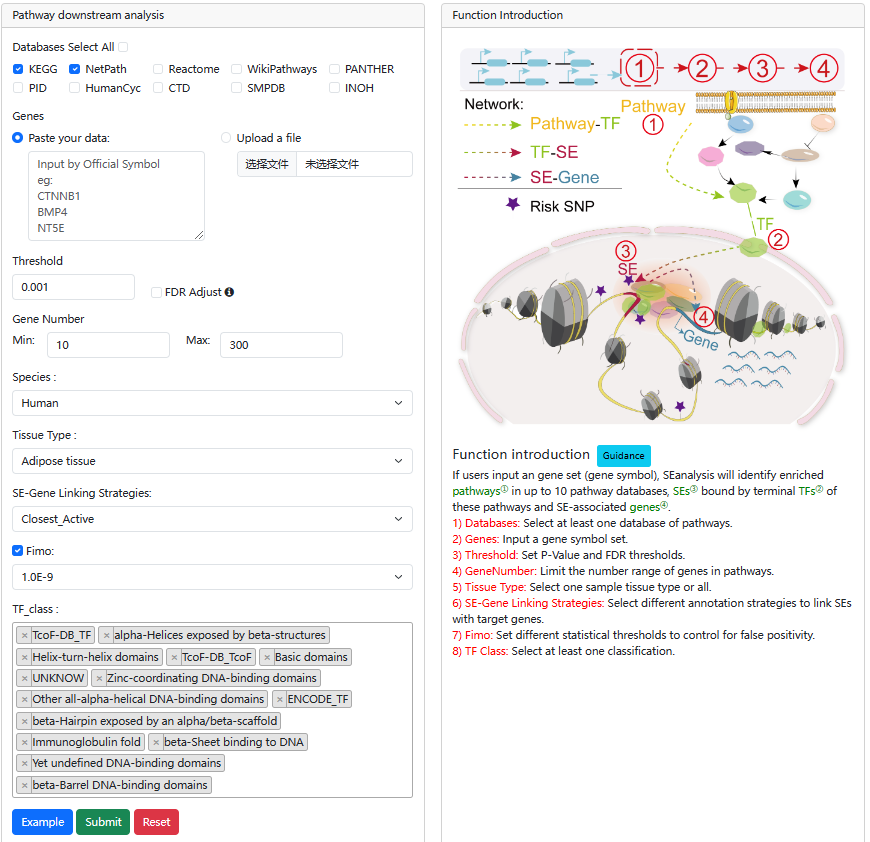
With the input of gene(s) of interest or a ‘txt’ format file, SEanalysis begins with the identification of which pathways① they are significantly enriched in, which terminal TFs② are downstream of identified pathways, which SEs③ and SE-associated genes④ are occupied by identified TFs (shown as 1→2→3→4 in Figure).
The guidance for input format:only gene symbol is supported (case-insensitive). Example of Upload File
Users can set p-value and FDR thresholds as well as the gene number to filter the results. SEanalysis offers ‘FIMO’ option to allow users to set different thresholds to control for false positivity. The 'SE-Gene Linking Strategies' option allows users to select different annotation strategies to link SEs with target genes. In addition, the ‘Tissue Type’ option allows user to perform targeted analysis in tissues of interest.
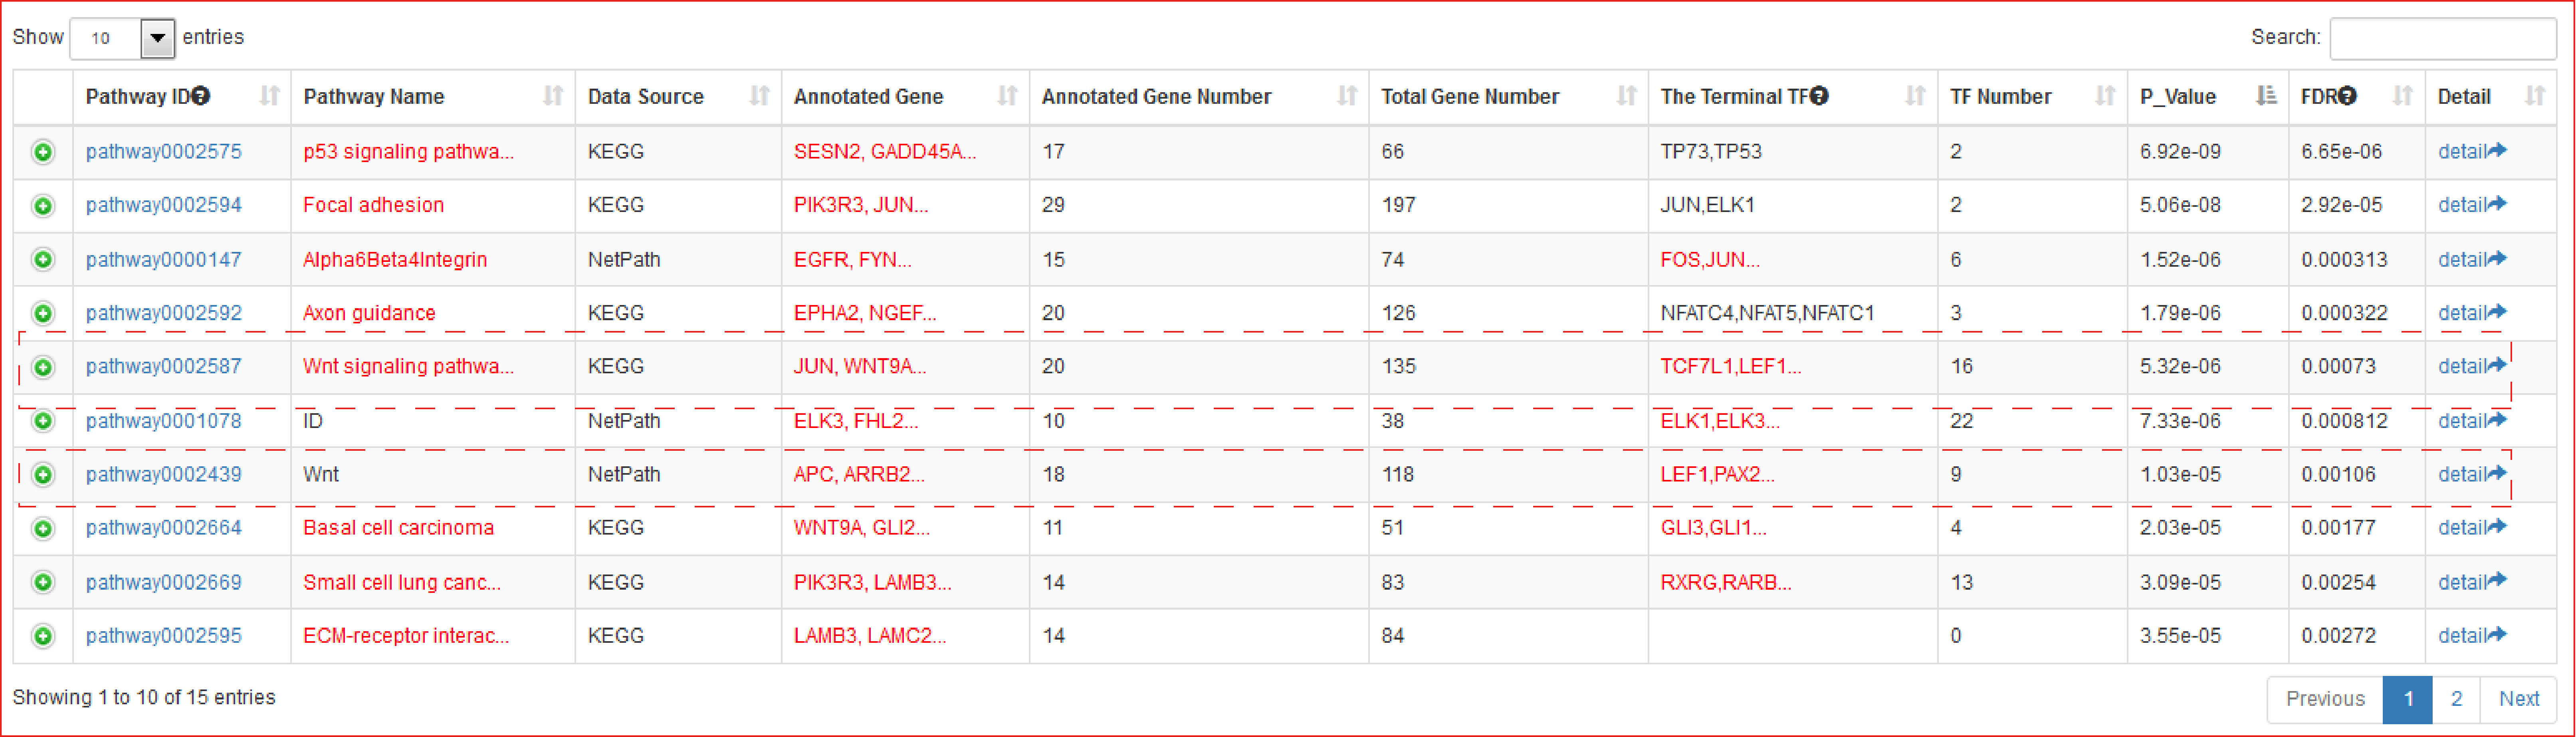
The output table shows pathway basic information (Pathway ID, Pathway name, Pathway source, Annotated gene, Annotated gene number, Total gene number, The terminal TF and TF number), enrichment score P-value and FDR. Furthermore, the number of the TF associated sample, SEs bound by TFs (identified by ChIP-seq experiments or predicted by motif analysis), genes associated with these SEs and pathways, and the classification of TFs can be viewed by clicking the "+" button. The pathways can be visualized by clicking the "pathway ID" button. The output table also provides a ‘detail’ page to further show the relationships between SEs bound by terminal TFs of pathways and genes associated with the SEs in each corresponding cell/tissue. The regulatory networks based on the pathway can also be dynamically visualized by applying different parameters. Users can also export these relationship tables.
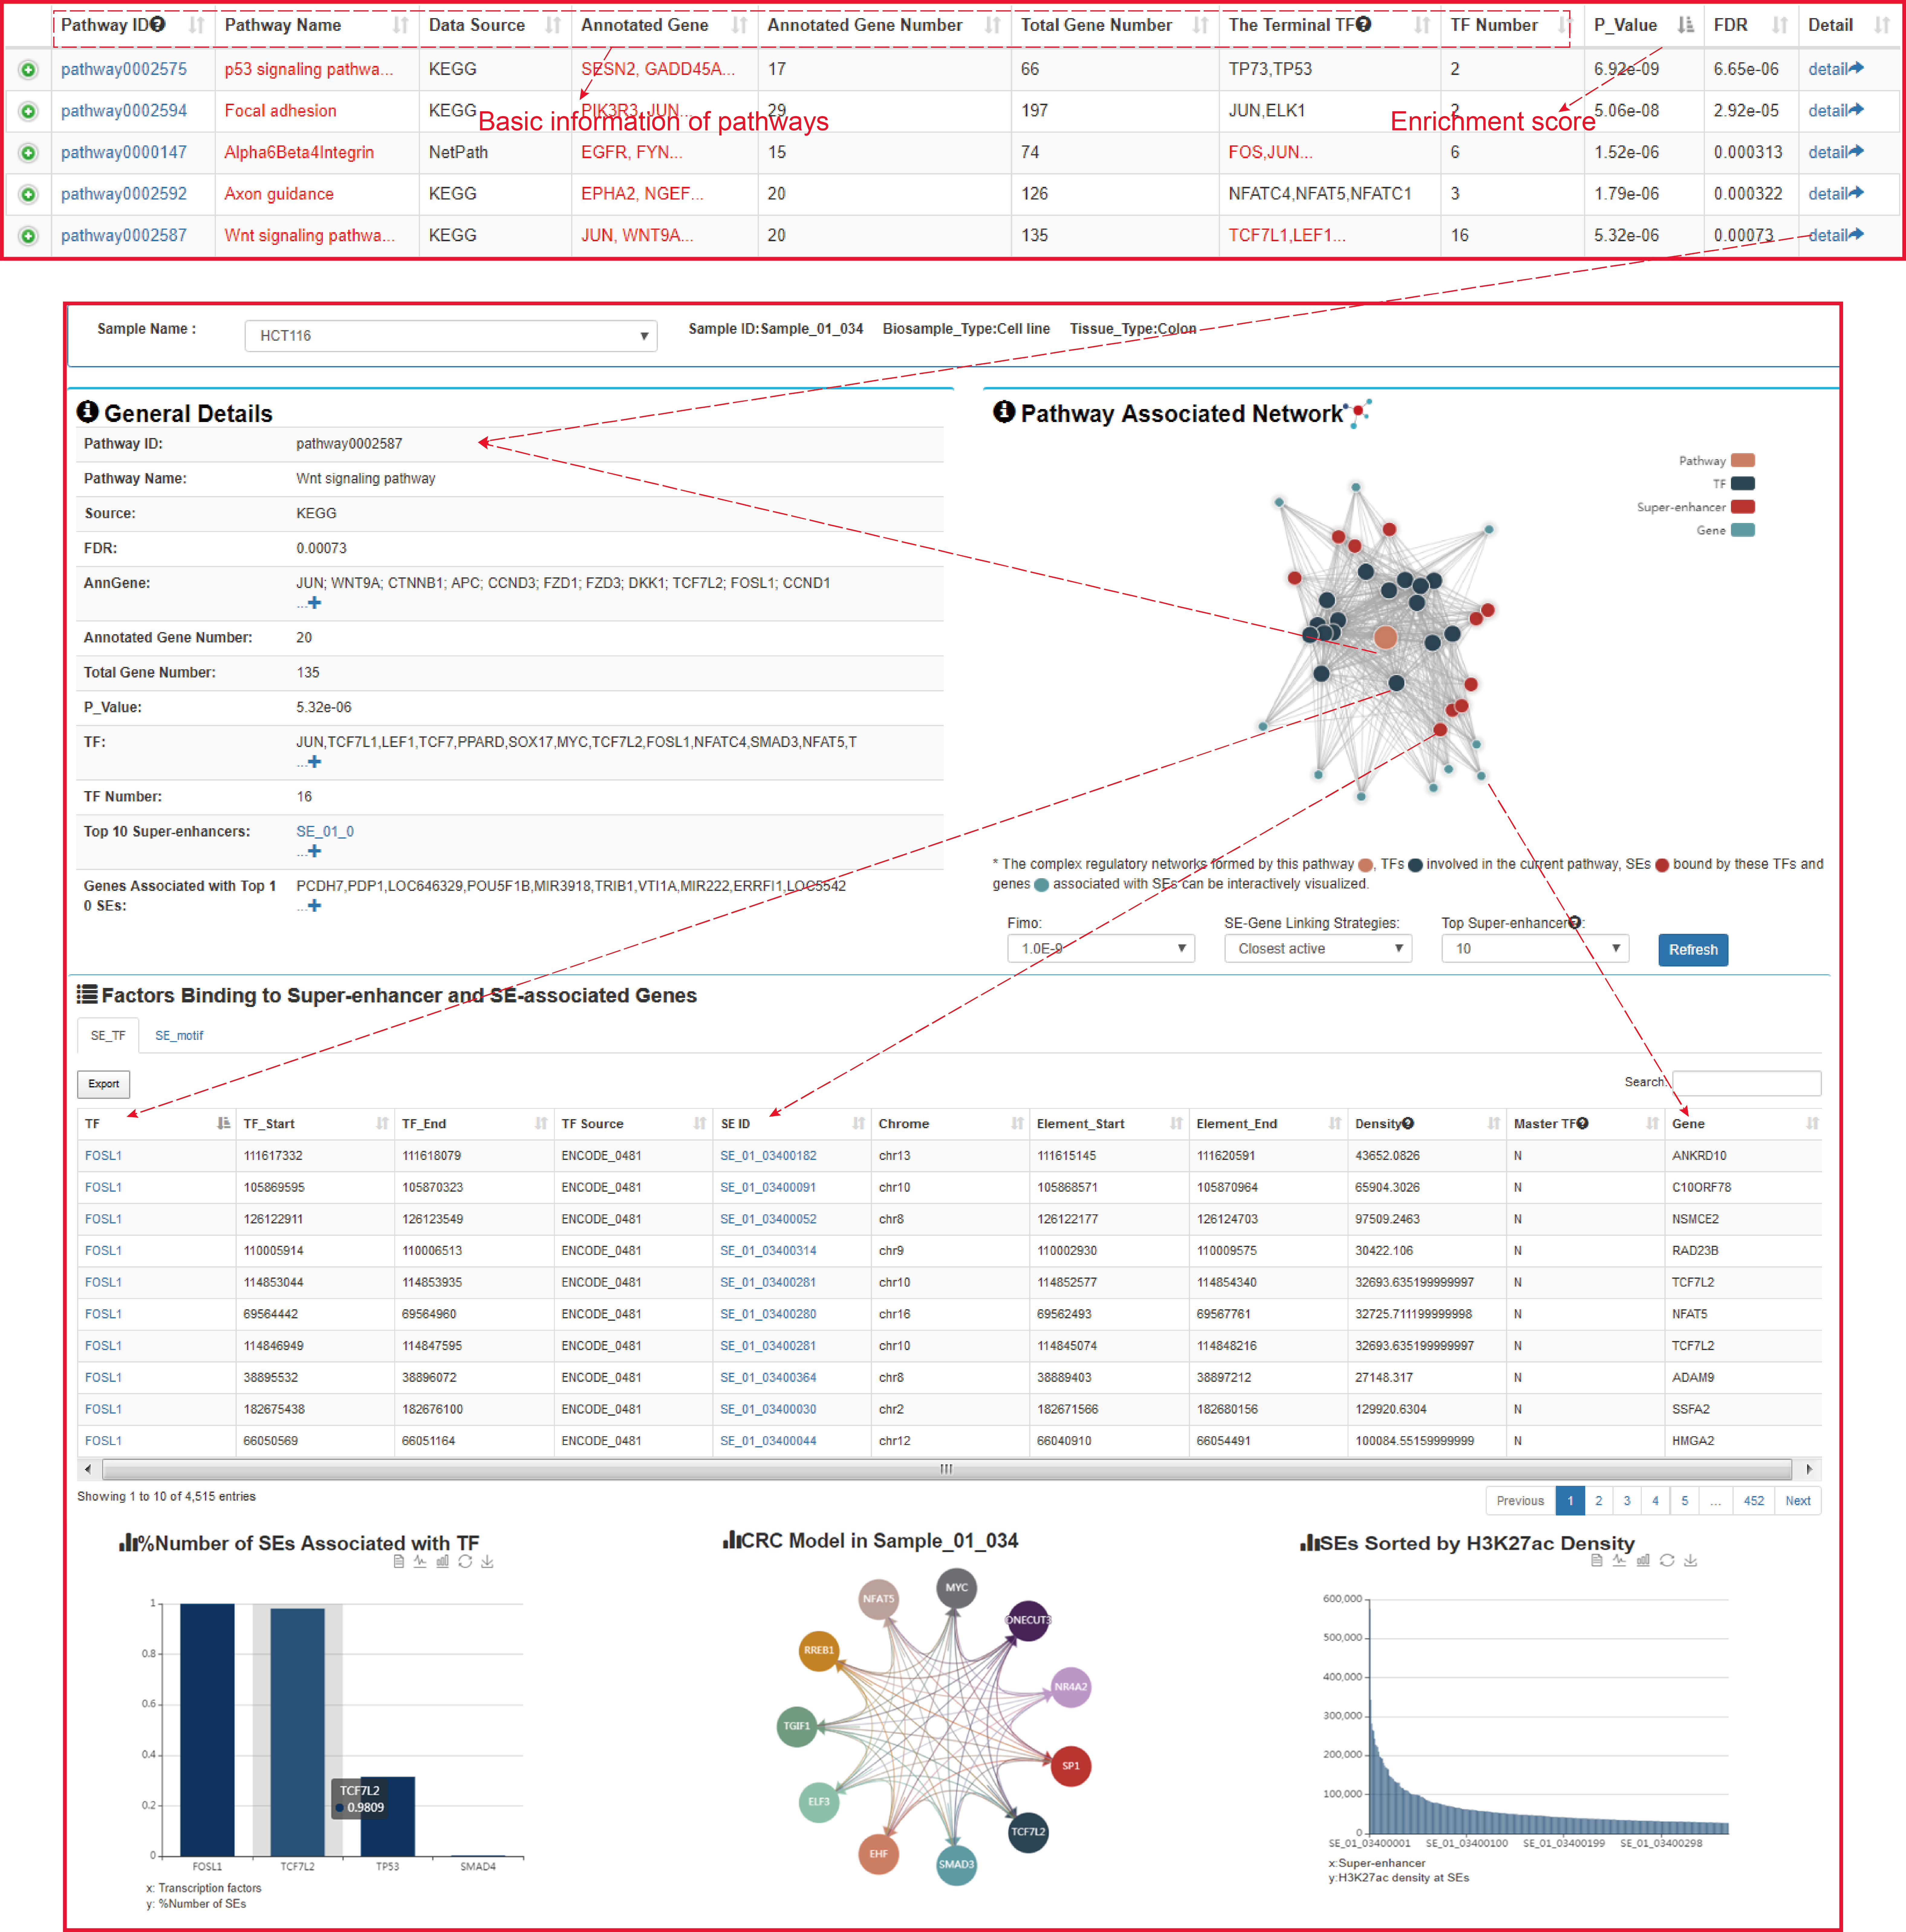
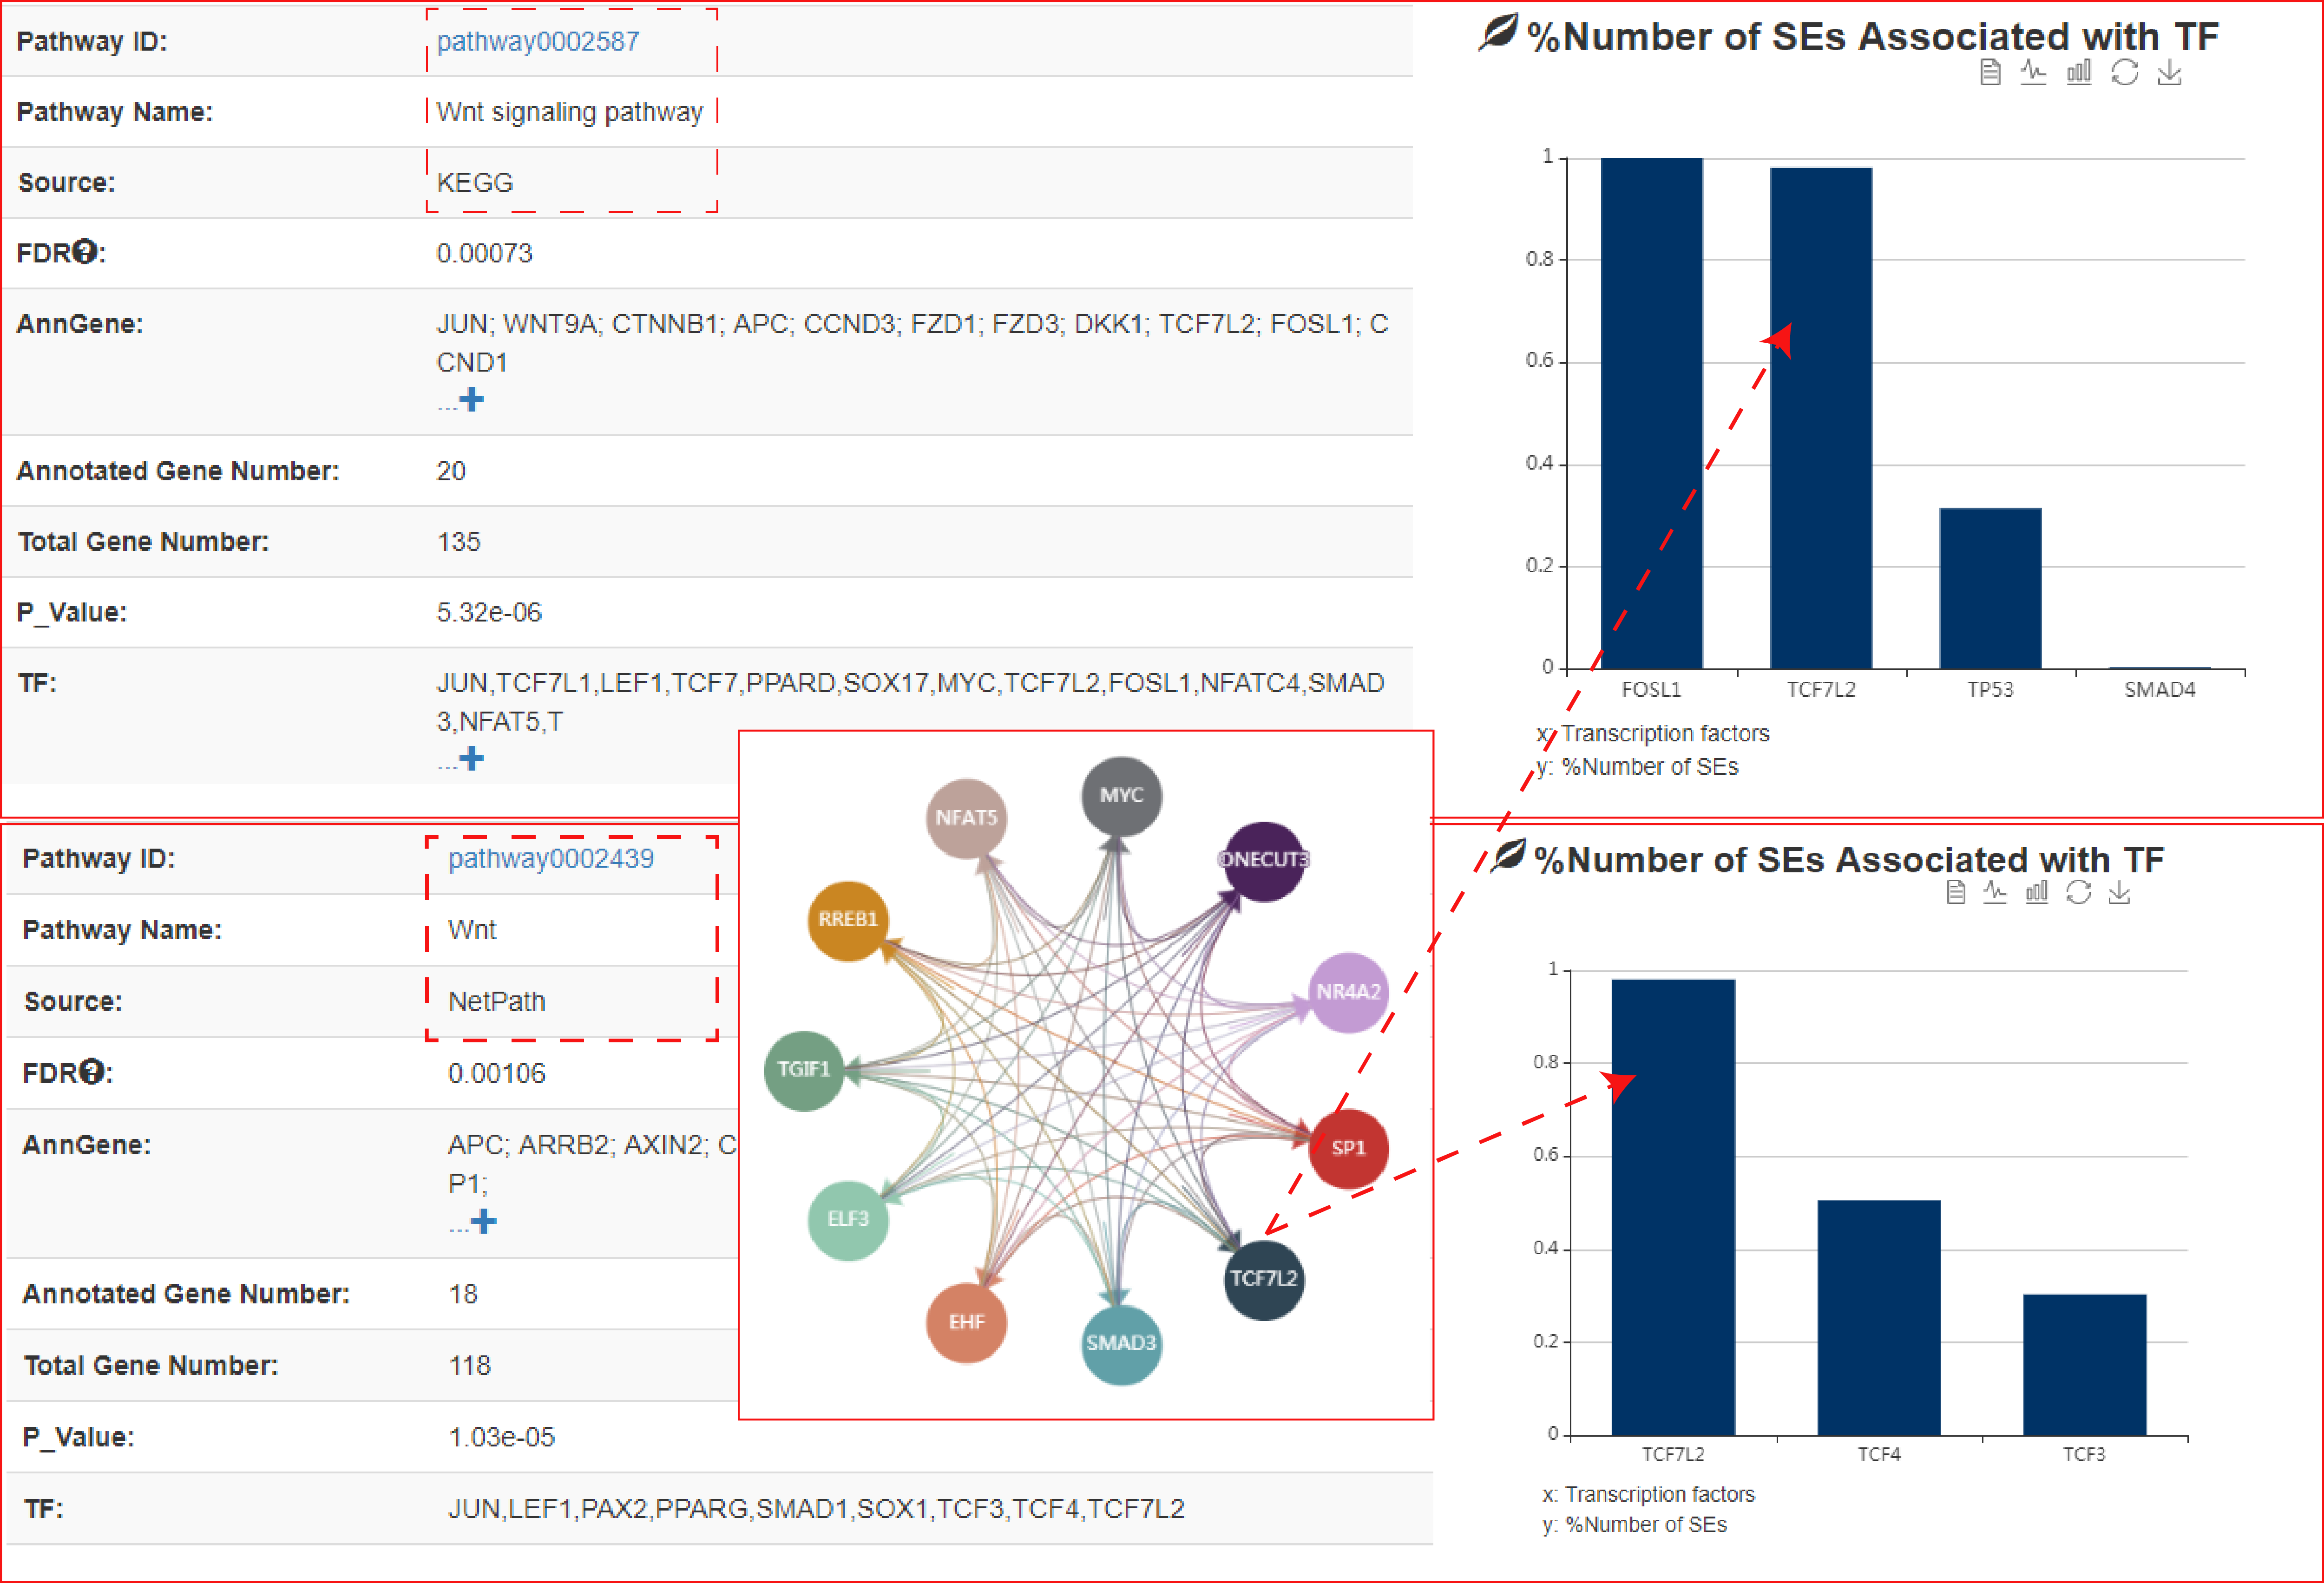
At the bottom of the figure above, the left histogram shows that the ratio of SEs associated with each TF in the current sample, the middle network shows that the master TFs predicted by CRC_Mapper, and the right histogram shows that SEs sorted by H3K27ac density.
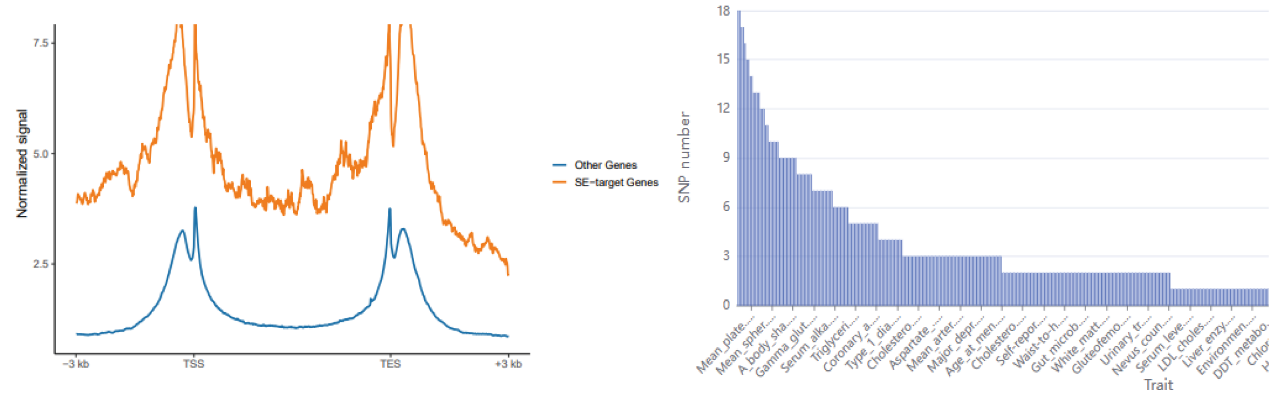
We also add gene activity score and statistics of risk SNP for diseases/traits.
2.2.Upstream regulatory analysis
URL: http://licpathway.net/SEanalysis/analysis2.do
In this analysis, by submitting a gene list or a ‘txt’ format file and users can
analyze their associated regulatory networks including associated SEs, TFs
binding to these SEs and their upstream pathways.
The guidance for input format:only gene symbol is supported (case-insensitive). Example of Upload File
User also can set different analytic parameters, including 1) ‘Tissue Type’ option which allows users to perform targeted analysis in tissues of interest; 2) ‘FIMO’ option which allows users to set different statistical thresholds to control for false positivity; 3)The 'SE-Gene Linking Strategies' option which allows users to select different annotation strategies to link SEs with target genes (closest active gene, ROSE overlap, ROSE proximal, ROSE closest); and 4) ‘Pathway Enrichment Threshold’ which allows users to set statistical thresholds to predict upstream pathways based on hypergeometric test.
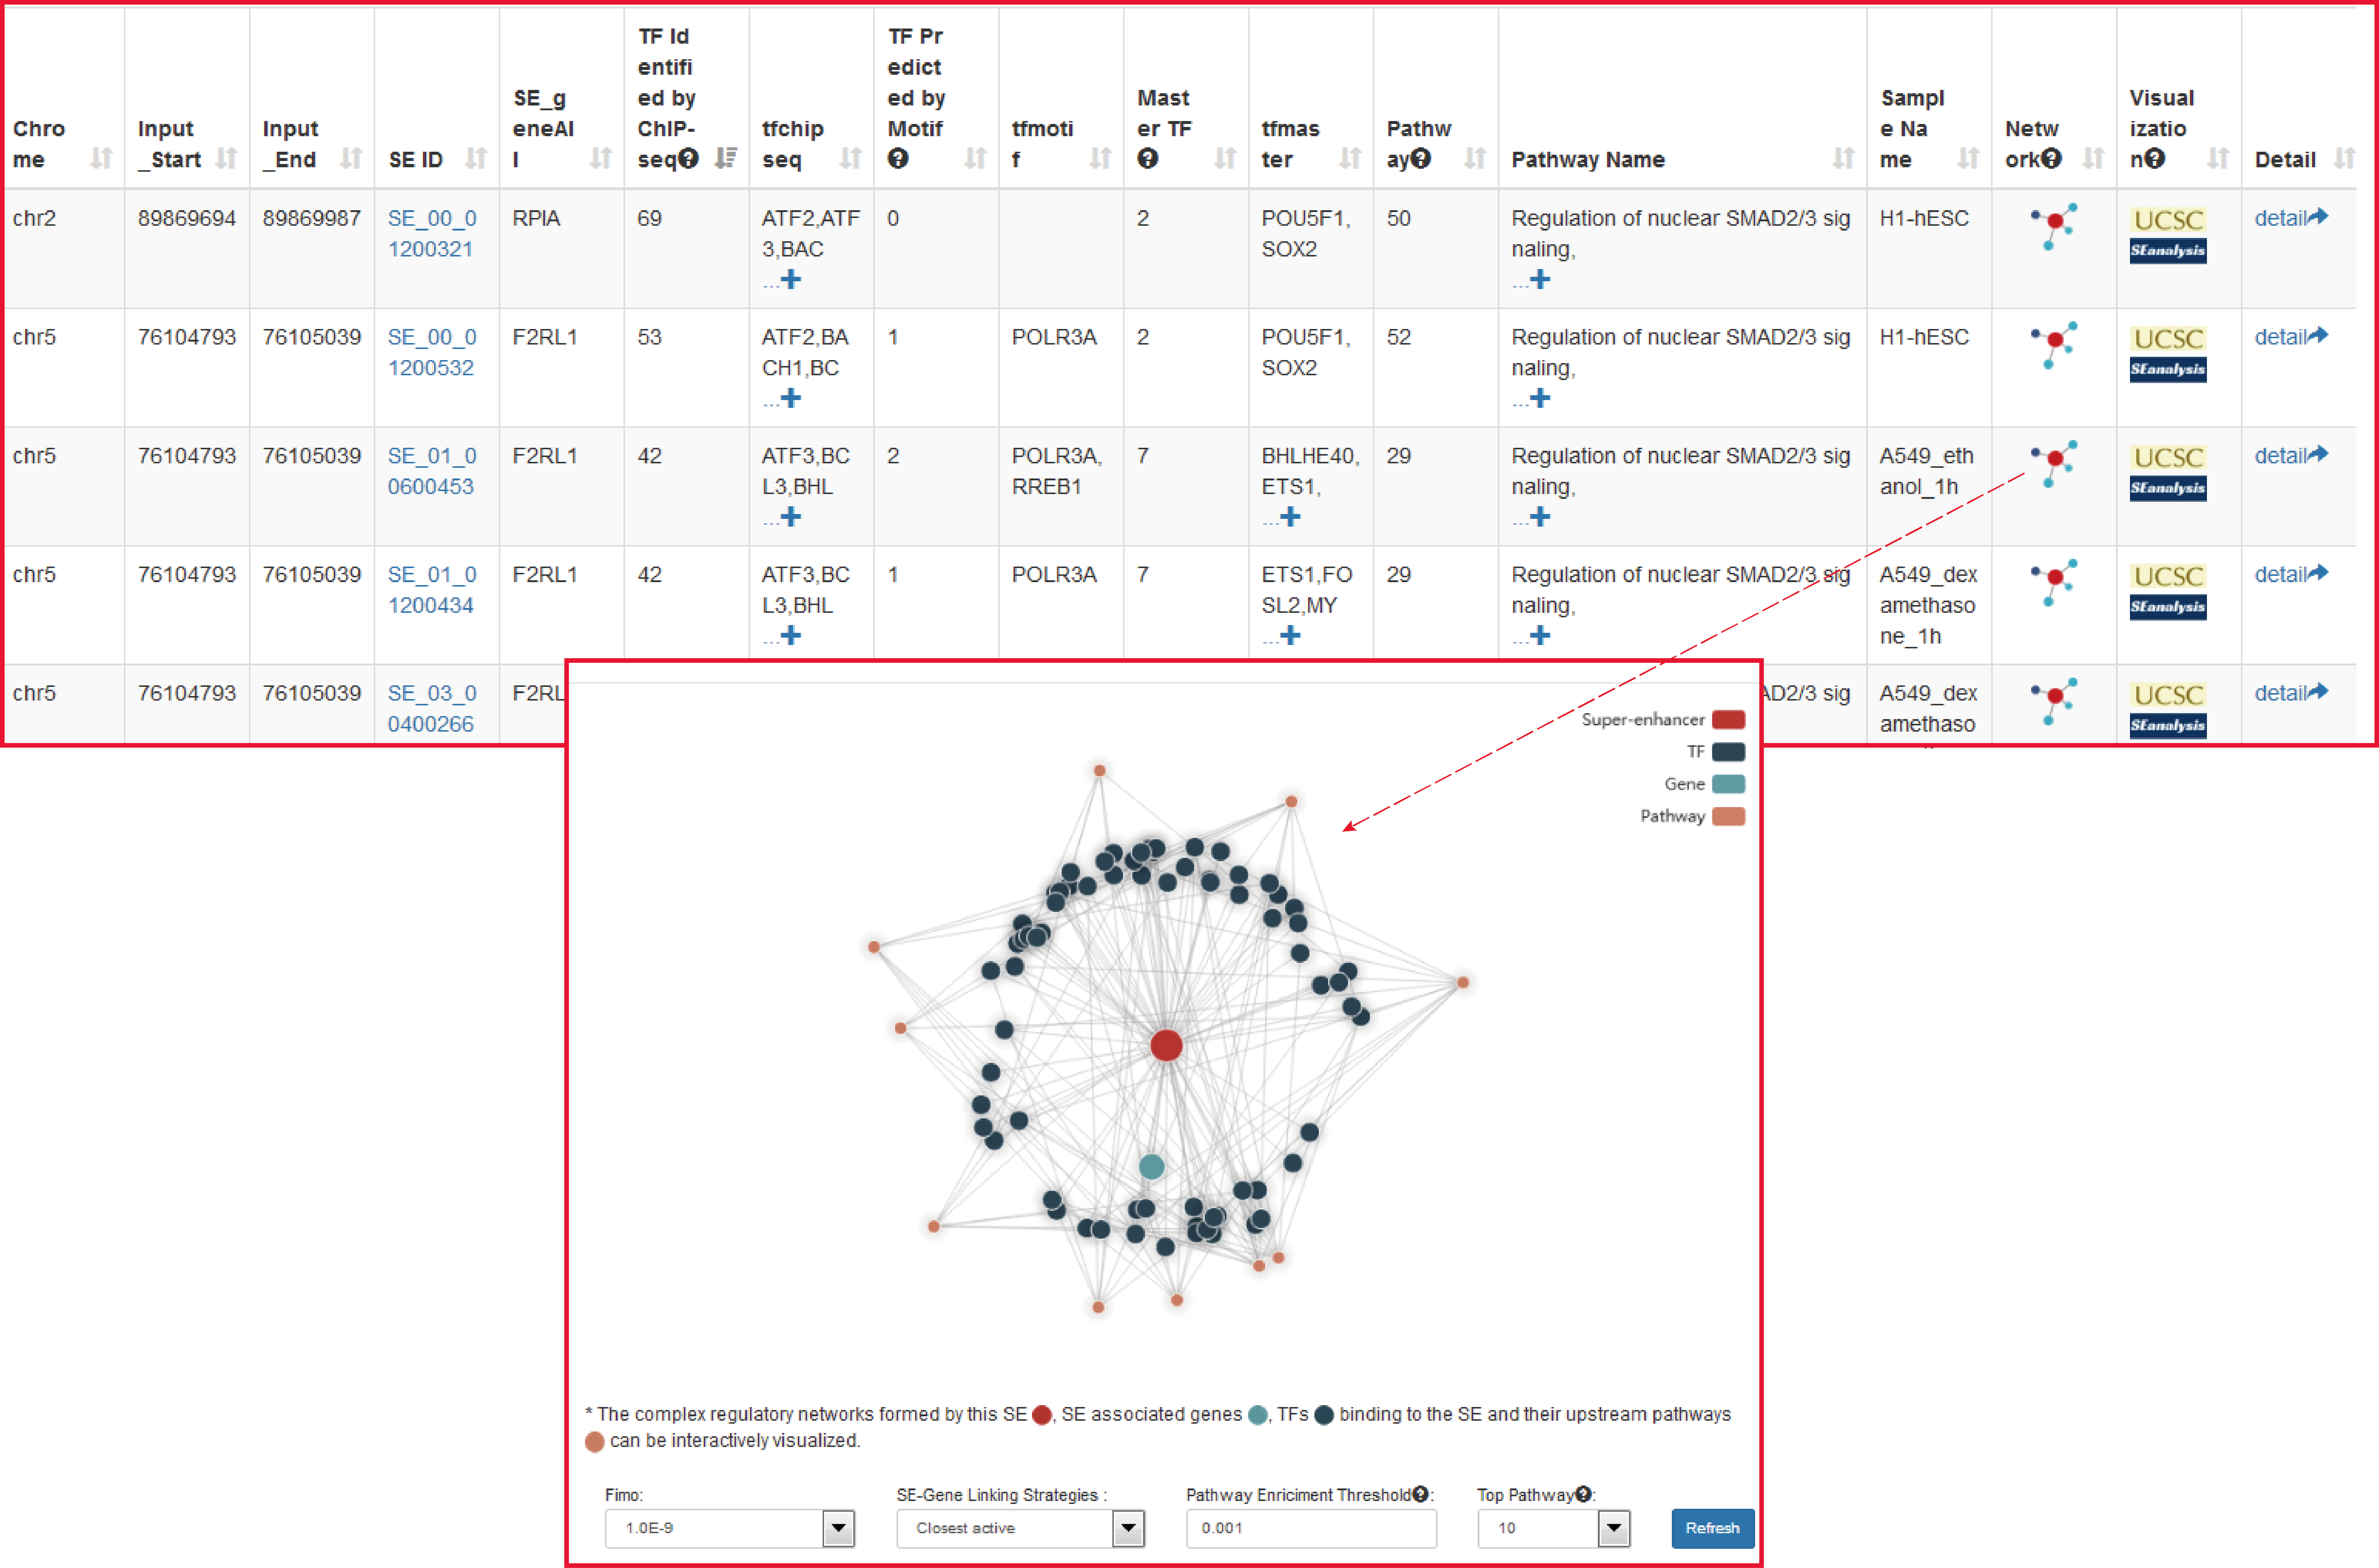
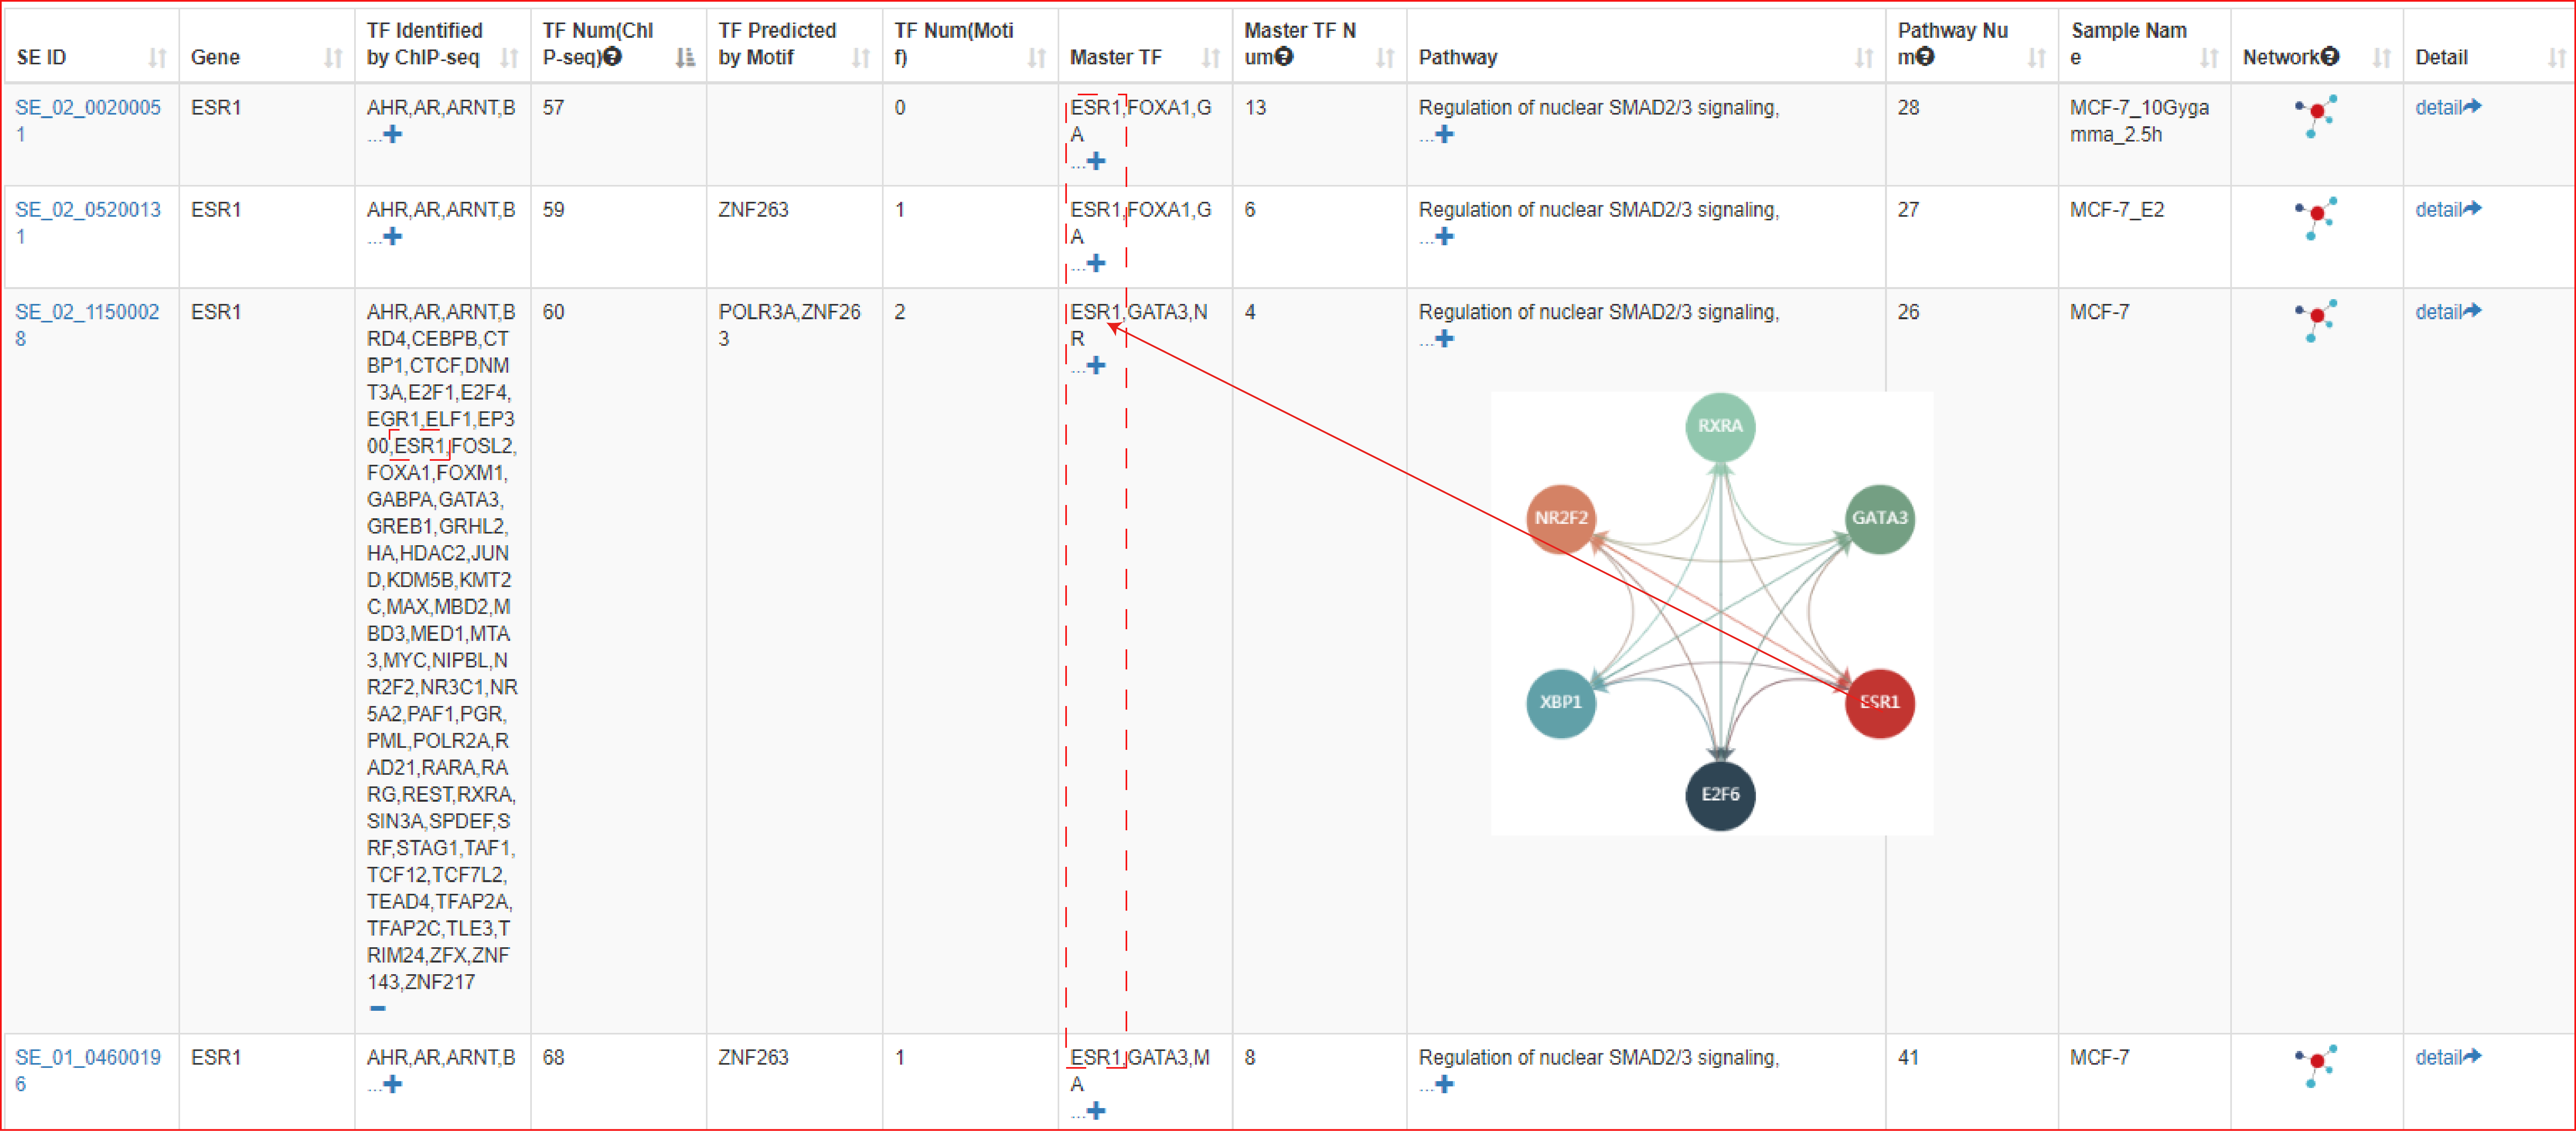
The output table of analysis will show: i) the relationships between the genes and SEs, ii) the number and names of TFs binding to these SEs (identified by ChIP-seq experiments or predicted by motif analysis), the number and names of master TFs binding to these SEs (predicted by CRC_Mapper), the number and names of upstream pathways and the sample information.
The complex regulatory network can be dynamically visualized by clicking  .
.
In addition, click the "detail" to browser the detailed information for the current SE.
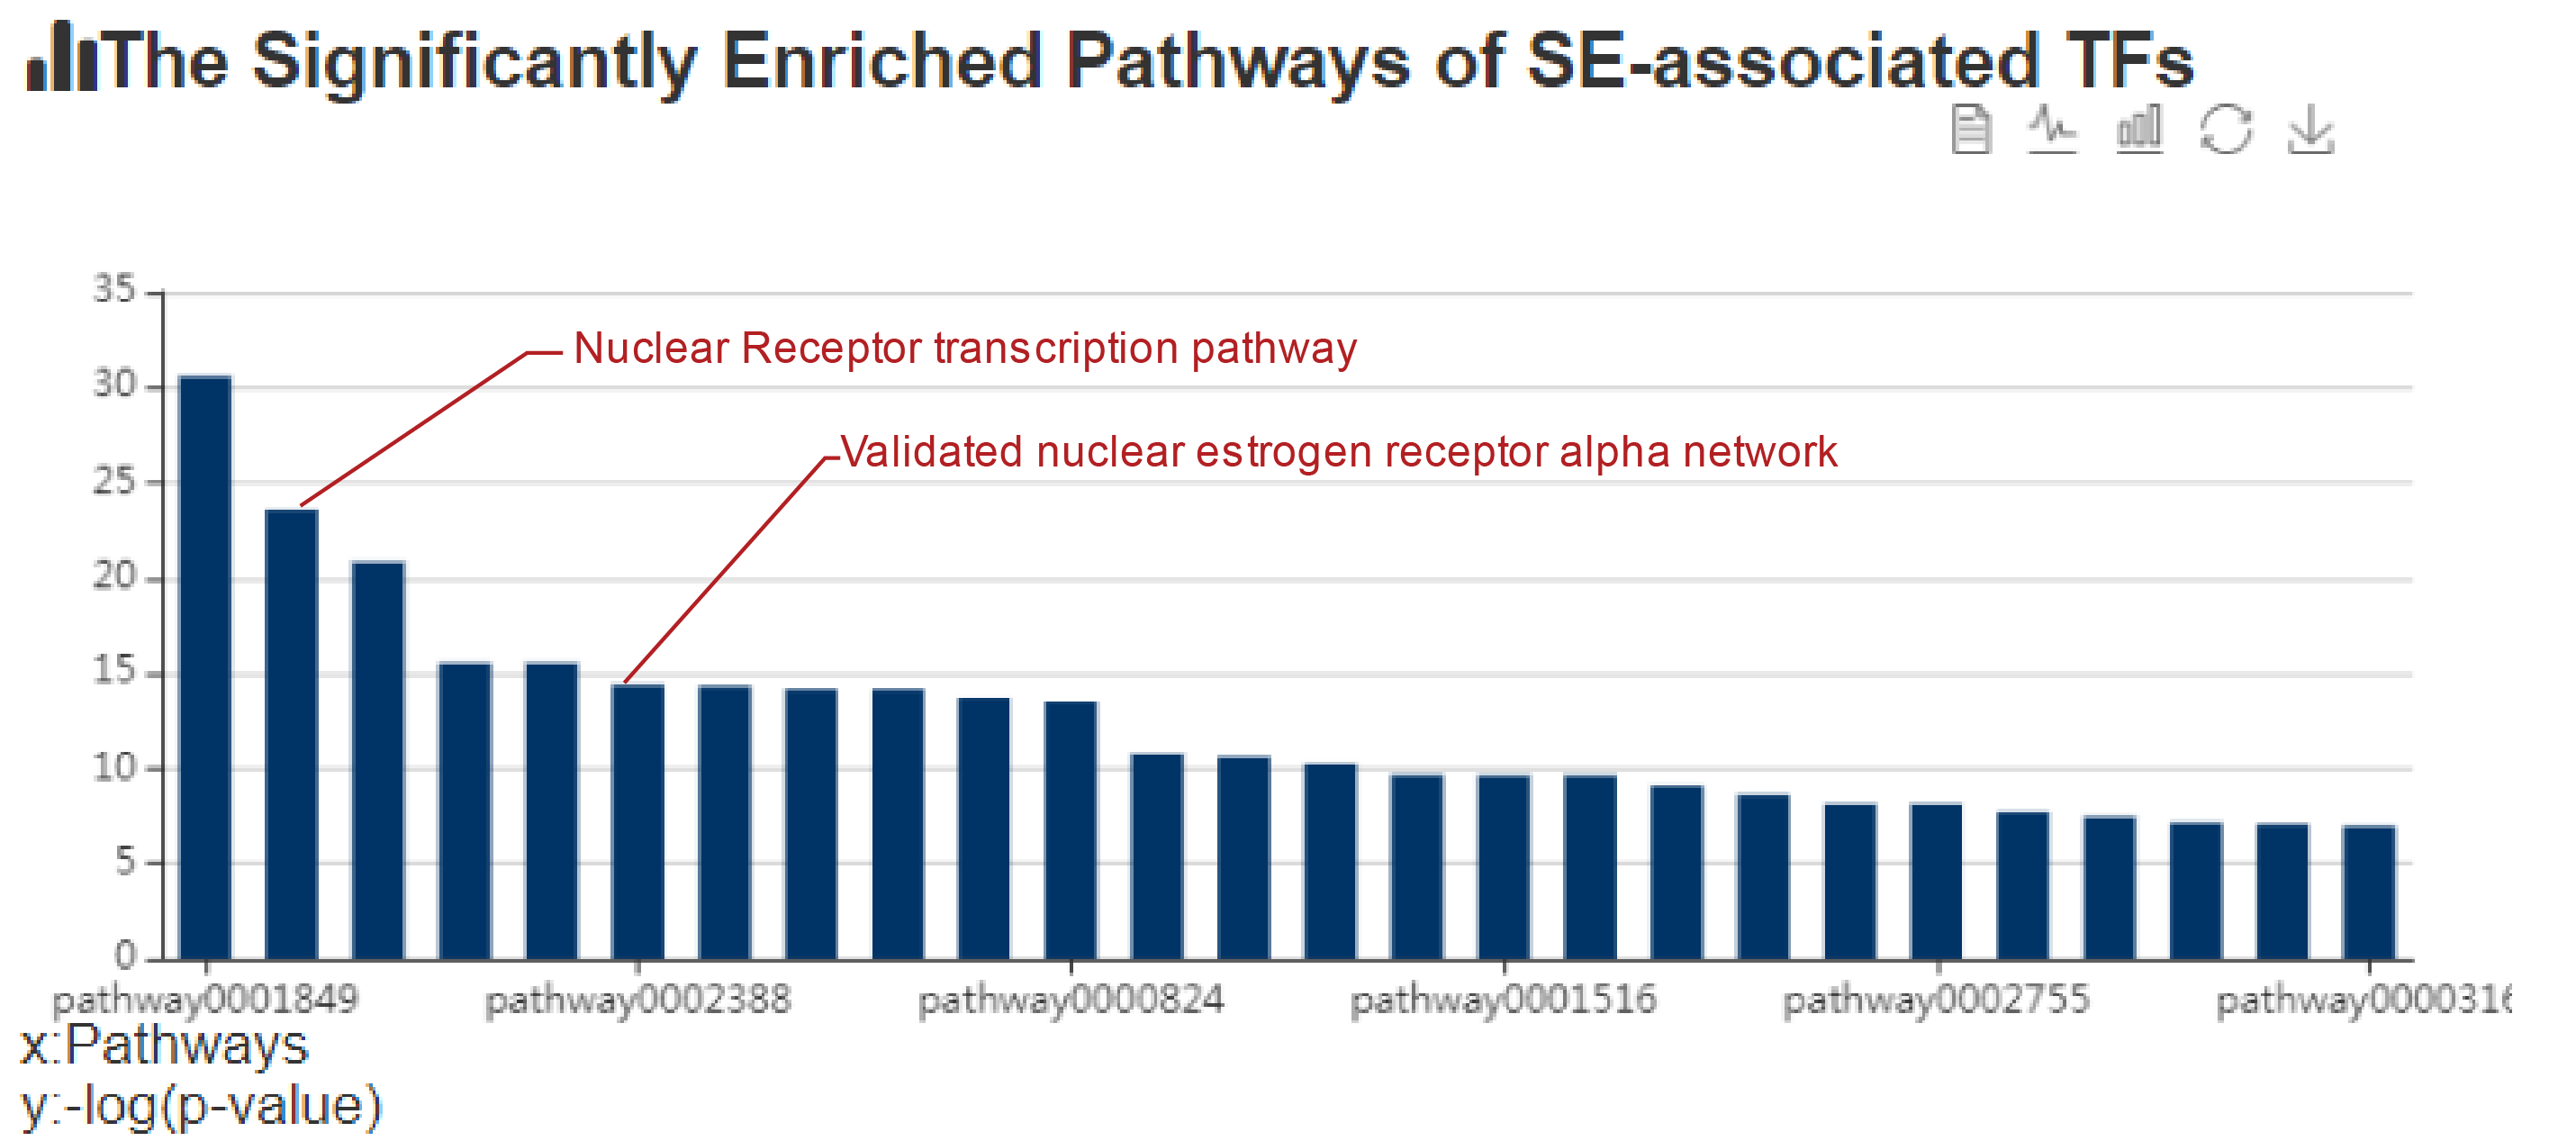
At the bottom of the figure above, the left network shows that the master TFs predicted by CRC_Mapper, and the right histogram shows that the significantly enriched pathways of SE-associated TFs.
2.3.Genomic region annotation
URL: http://licpathway.net/SEanalysis/analysis3.do
In this analysis, by uploading a ‘bed’ format file or a region list, users can
identify SEs overlapping with the queried genomic regions, TFs binding to these
SEs and their upstream pathways. The guidance for input format is as below:
Region definitions are ordinary 3-field bed file format.
#column 1: The name of the chromosome (e.g. chr3, chrY).
#column 2: The starting position in the chromosome.
#column 3: The ending position in the chromosome.
#fields must be tab-separated.
For example: Example of Upload File
User also can set different analytic parameters, including 1) ‘Tissue Type’ option which allows users to perform targeted analysis in tissues of interest; 2) ‘FIMO’ option which allows users to set different statistical thresholds to control for false positivity; 3)The 'SE-Gene Linking Strategies' option which allows users to select different annotation strategies to link SEs with target genes (closest active gene, ROSE overlap, ROSE proximal, ROSE closest); and 4) ‘Pathway Enrichment Threshold’ which allows users to set statistical thresholds to predict upstream pathways based on hypergeometric test. Users can also set the percentage of overlap and background in the "setting" section.
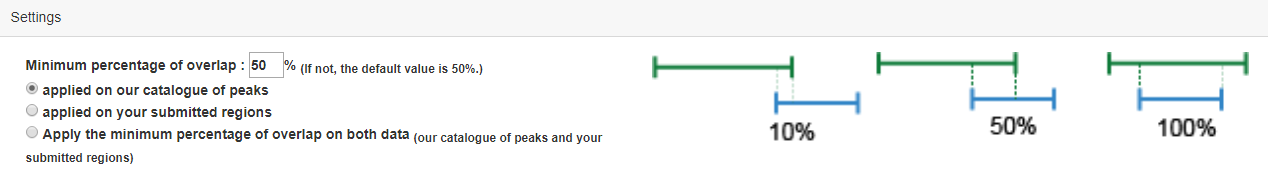
Upon clicking the "Run" button, the output table will show: i) the identified SEs overlapping with the input regions and SE-associated genes; ii) the number and names of TFs binding to these SEs (identified by either ChIP-seq experiments or predicted by motif analysis); iii) the number and names of master TFs binding to these SEs (predicted by CRC_Mapper); iv) the number and names of upstream pathways and the sample information. The complex regulatory network based on SEs can be dynamically visualized by setting different parameters. In addition, users can browse further the detailed information on the current SE by clicking the "SE ID" button.
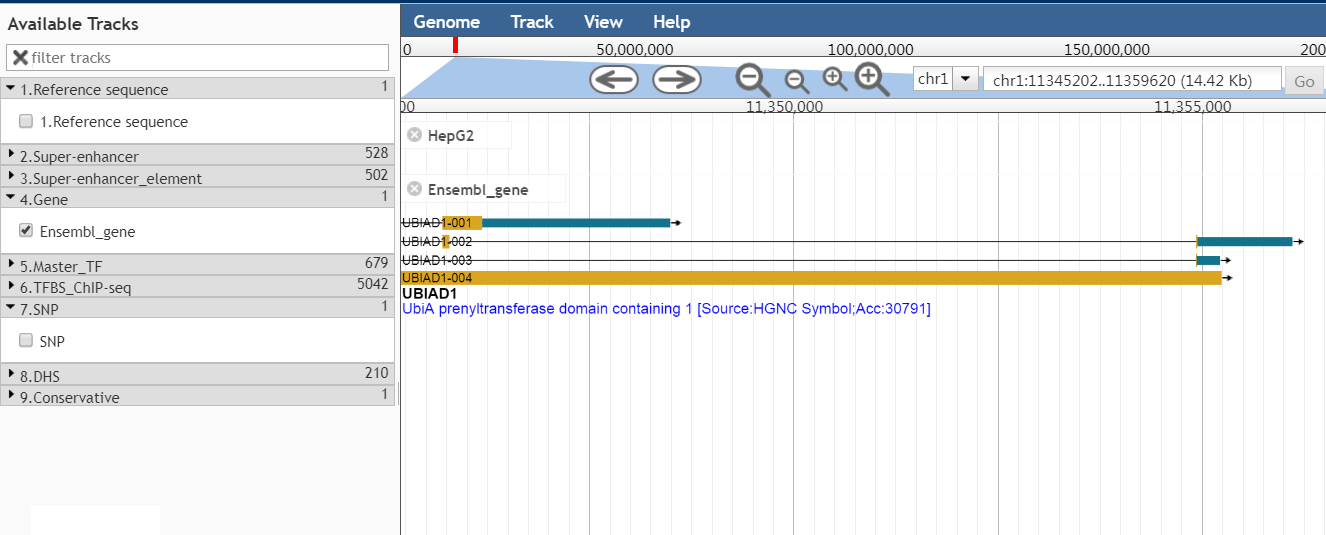
To view SEs in the genome, we developed a customized genome browser using JBrowse. Users can view genomic coordinates of SEs, TF binding sites identified by ChIP-seq, SNPs, DHSs, and conservation score. SEanalysis can also link the data to the UCSC genome browser.
2.4.TF regulatory analysis
URL: http://www.licpathway.net/SEanalysis/tfRegulatoryAnalysis
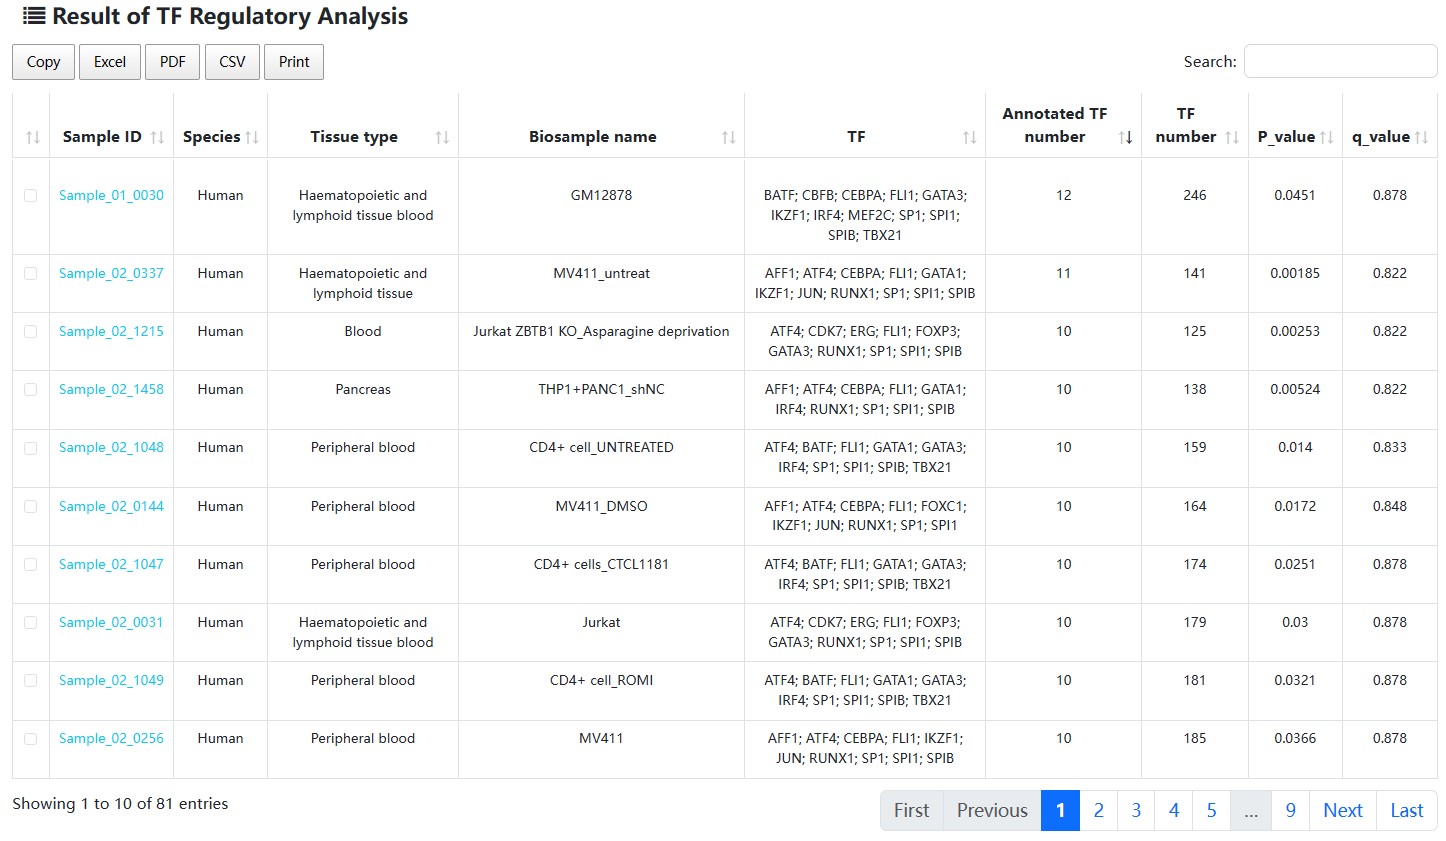
With the input of TFs of interest and the setting of the enrichment significance p-value, SE-Gene linking strategies, and FIMO Threshold, SEanalysis 2.0 will first determine a scope of TFs in each sample based on the significance p-value set by users. The guidance for input format:only gene symbol is supported (mouse: Capitalize the first letter; Human: Capitalize all letters).
Users can set p-value and FDR thresholds as well as the gene number to filter the results. SEanalysis offers ‘FIMO’ option to allow users to set different thresholds to control for false positivity. The 'SE-Gene Linking Strategies' option allows users to select different annotation strategies to link SEs with target genes. In addition, the ‘Tissue Type’ option allows user to perform targeted analysis in tissues of interest.
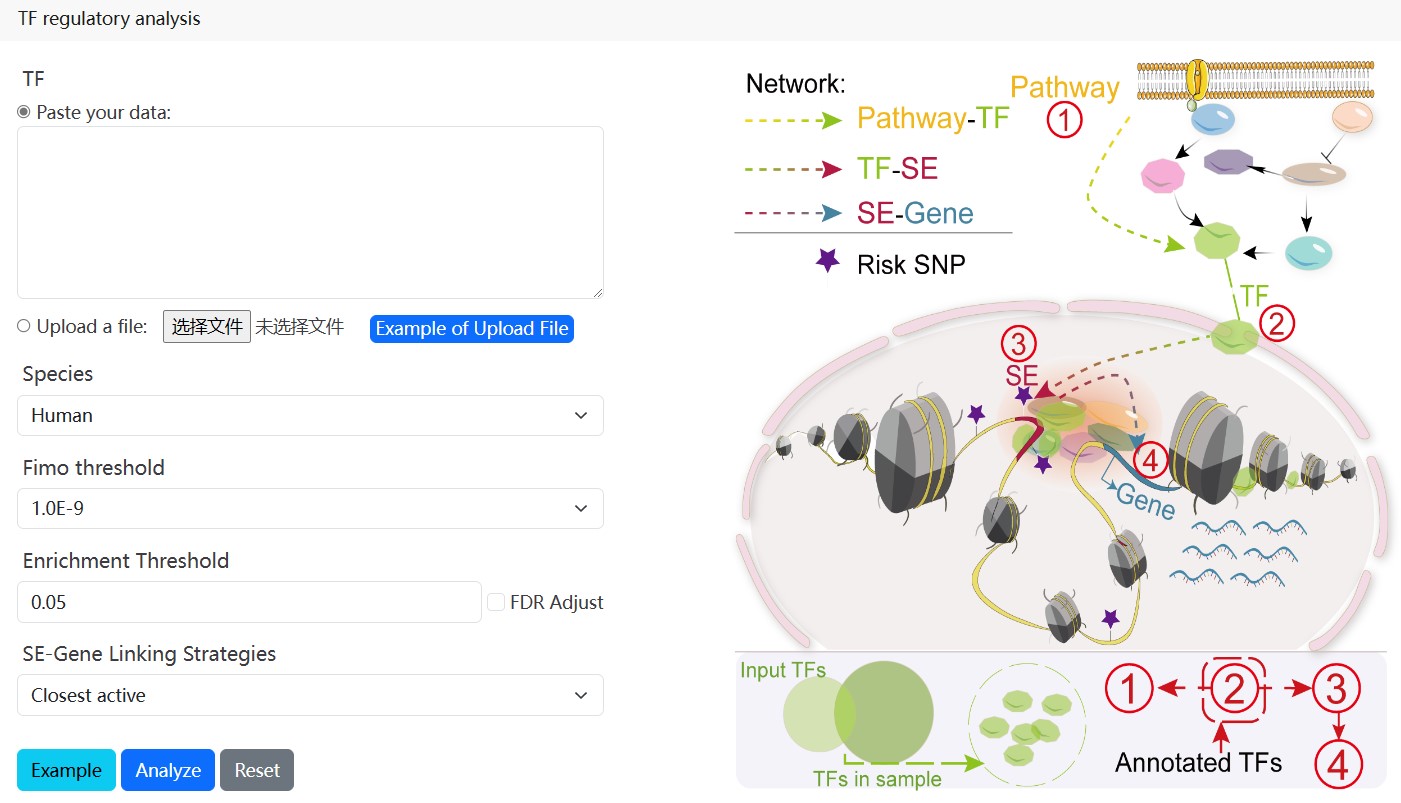
The result table includes ‘Sample ID’, ‘Species’, ‘Tissue type’, ‘Biosample name’, ‘Annotated TF’, ‘Annotated TF number’, ‘ALL TF number’, ‘p_value’ and ‘q_value’.
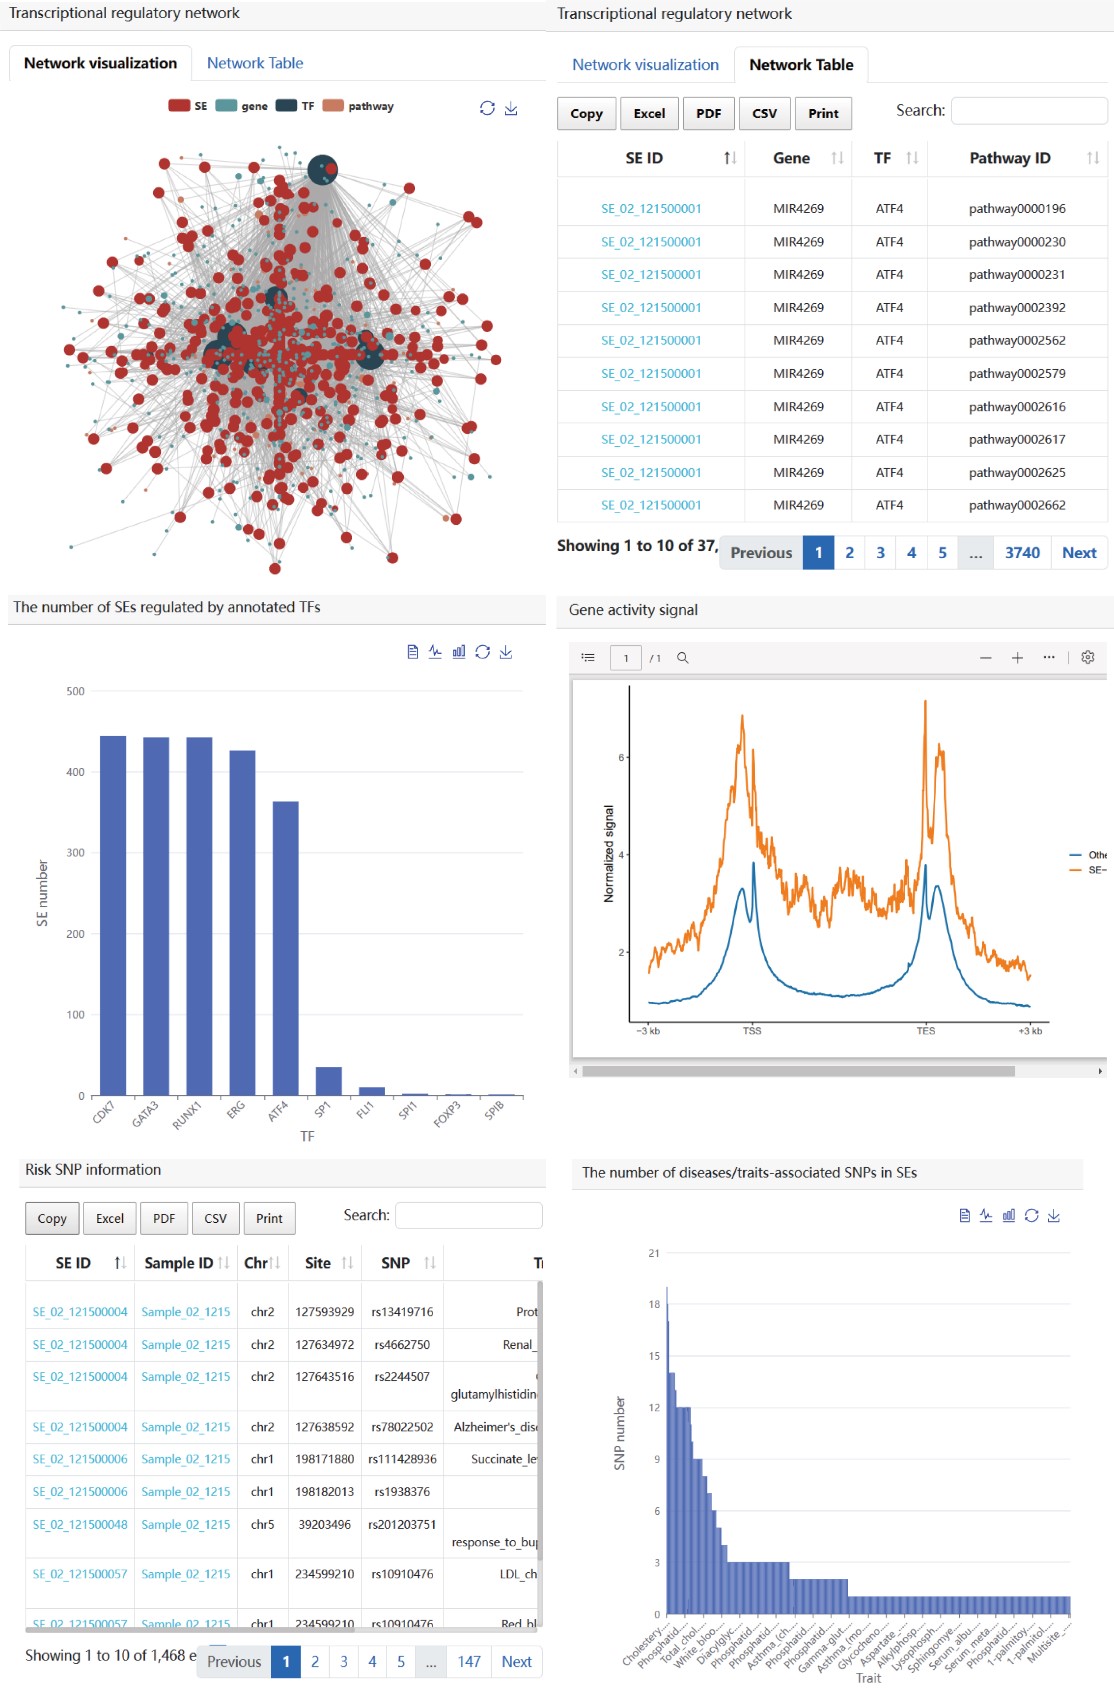
Next, users can further select up to two samples of interest and click the ‘Submit’ button to obtain the visualization and table of regulatory network formed by annotated TFs in a sample. Meanwhile, the number of SEs bound by each annotated TF, activity score of genes related with SEs bound by TFs, risk SNP annotation for each SE, the number of risk SNPs for each disease/trait will be shown in below. (shown as 1→2→3→4 in Figure).
2.5.Sample comparative analysis
URL: http://www.licpathway.net/SEanalysis/tfRegulatoryAnalysis
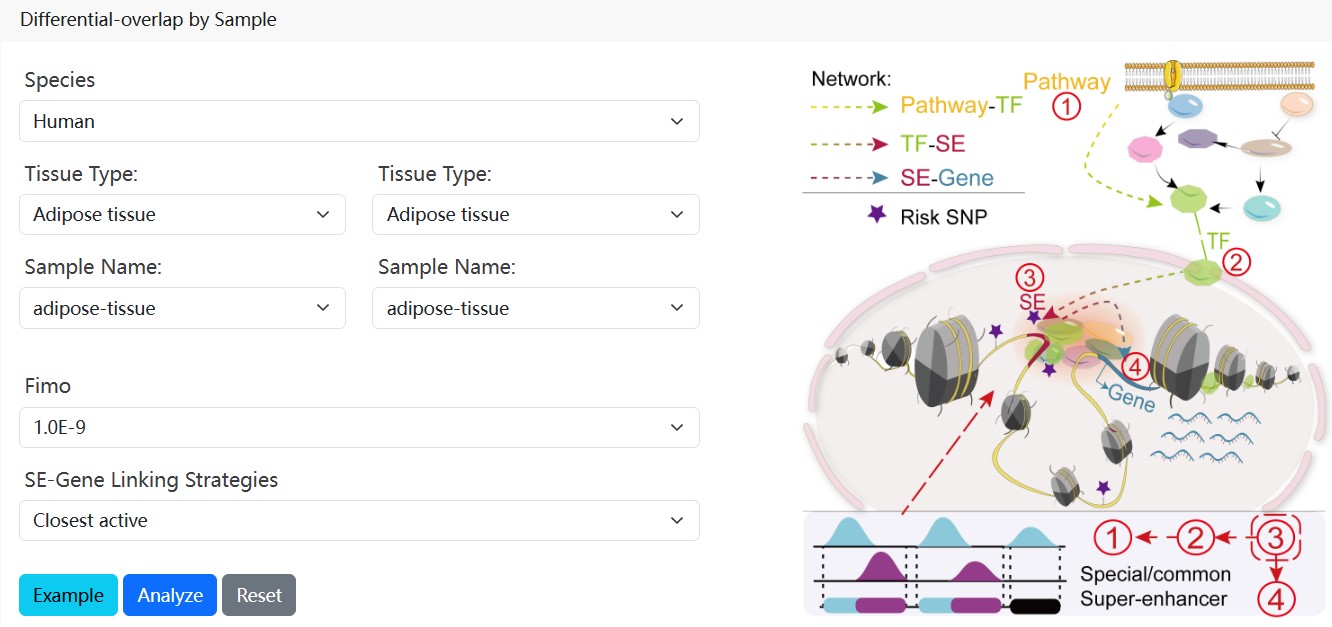
Users can select two SE samples of interest filtering by ‘Species’, ‘Tissue Type’ and ‘Sample Name’. Further, users can choice multiple thresholds, including ‘Fimo Threshold’ and ‘SE-Gene Linking Strategies’. The "sample comparison analysis" will return the detailed regulatory network information of all/common/specific SEs in the two samples, which will contribute to evaluate the different regulatory roles of these SEs.
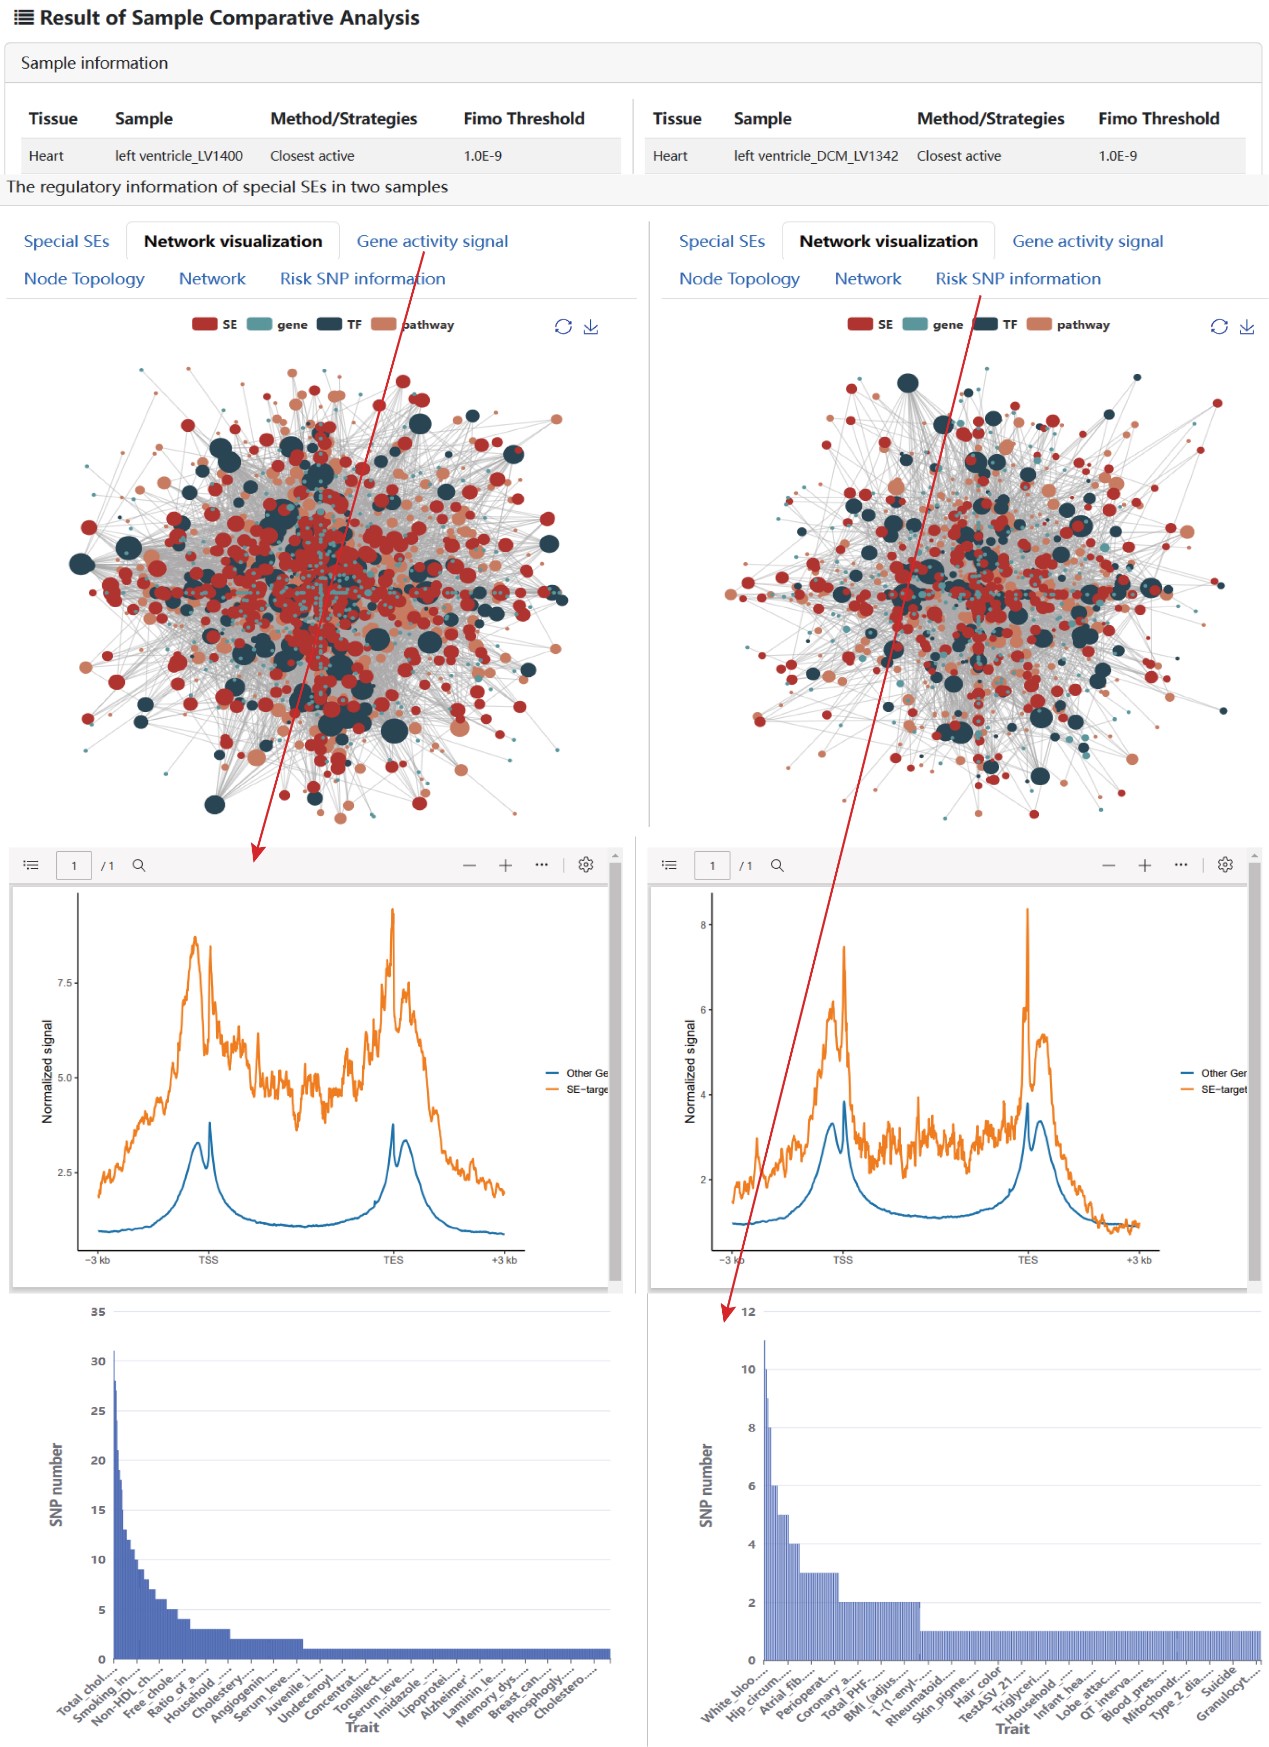
The output result includes: i) the detail information of the selected SE samples, ii) the table and visualization of corresponding regulation networks of all/common/specific SEs, iii) the gene activity score, and iv) the topology of each node in network, and v) the information of risk SNPs within SE region for each disease/trait.
2.6.Case studies
We used the experimental data from two different studies to validate the key predictions of SEanalysis.
2.6.1.Pathway downstream analysis
For ‘Pathway downstream analysis’, we re-analyzed the work wherein a colon cancer cell line (HCT116, known to be dependent on Wnt activation for proliferation) was treated with Wnt inhibitor or stimulator followed by RNA-seq. We first obtained 943 differentially expressed genes upon treatment with Wnt modulators from Array Express experiment E-MTAB-651 (https://www.ebi.ac.uk/arrayexpress/experiments/E-MTAB-651/) (p-value < 0.001, |log2(Foldchange)|>1). These genes were used as input for our webserver for ‘Pathway downstream analysis’ (parameters: Databases: KEGG and NetPath, Threshold: p-value < 0.001, GeneNumber: Min: 10 and Max: 300, Tissue Type: Colon, SE-Gene Linking Strategies: Closest active and FIMO: 1e-9).
The output table showed that Wnt pathway was not only significantly enriched (Hypergeometric test; p-value = 5.32e-06) but it was also the sole pathway identified by both pathway sources (KEGG and NetPath), and furthermore, it ranked highly as 5th and 7th among all pathways identified.
The webserver next identified a number of terminal TFs downstream of Wnt signaling pathway, including TCF7L2, TCF3, TCF4 and FOSL1. Importantly, using TCF7L2 ChIP-seq generated in HCT116 cells, our analysis showed that TCF7L2 occupied the vast majority of HCT116 SEs (98% of total SEs), which is consistent with the result of Hnisz et al and validated the prediction of webserver. Compared to other terminal TFs of Wnt pathway, TCF7L2 occupied a greater percentage of SEs in both KEGG and NetPath.
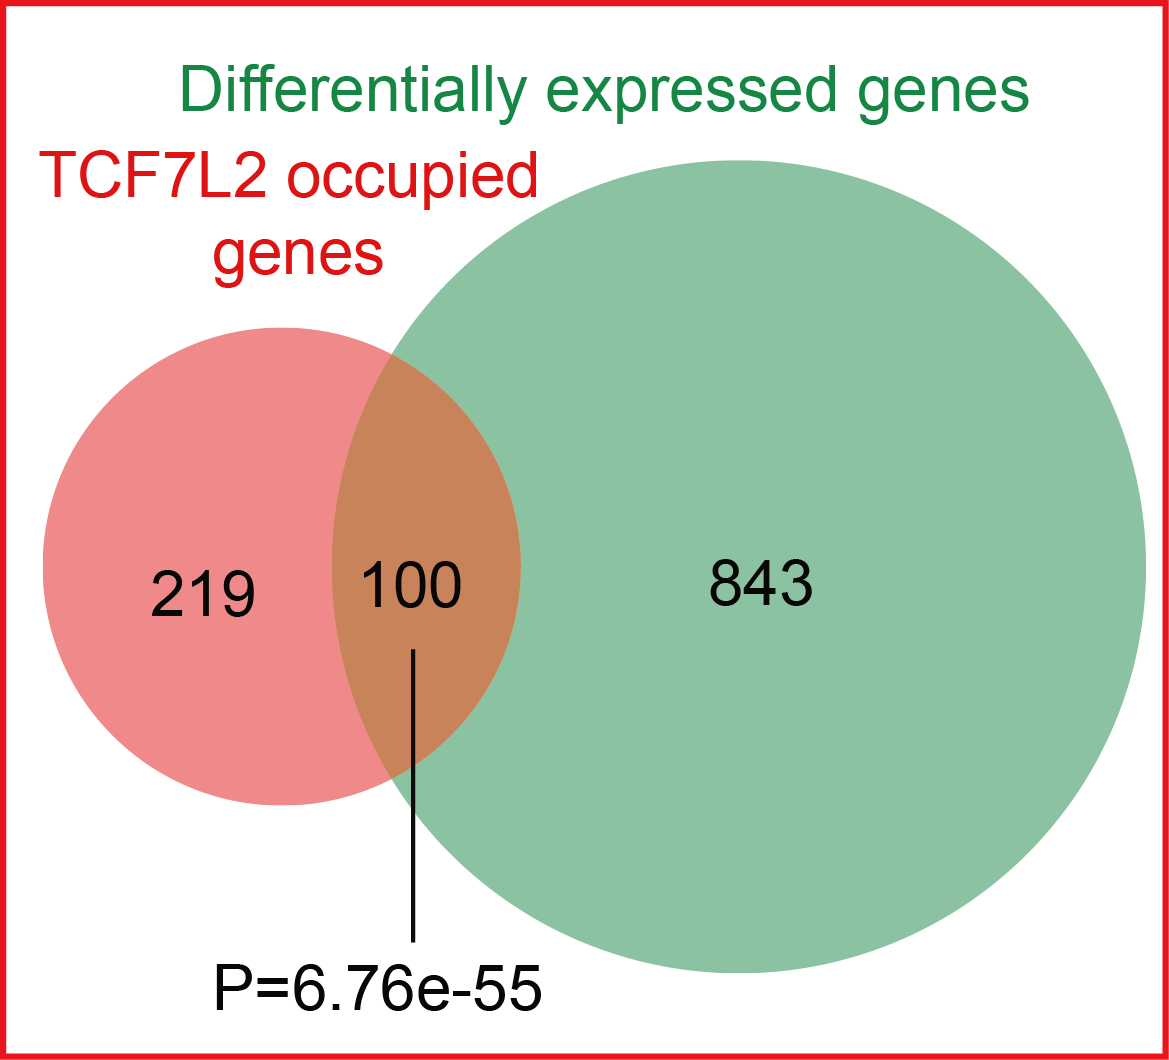
Lastly, we tested whether these SE-associated genes occupied by TCF7L2 were responsive to the manipulation of the Wnt pathway. Notably, these SE-associated genes occupied by TCF7L2 were significantly enriched in those exhibiting expression changes after disruption of Wnt pathway (Hypergeometric test; p-value = 6.76e-55), again confirming the previous report.
Some of these TCF7L2-occupied, SE-associated genes included well-established Wnt targets, such as MYC, CCND1 and EGFR. Considering the well-established role of TCF7L2 in mediating Wnt signaling pathway through occupying super-enhancers, these results suggest the value and usefulness of our webserver in linking pathways, terminal TFs and super-enhancer activity.

2.6.2.Upstream regulatory analysis
To validate the prediction of ‘Upstream regulatory analysis’, we studied luminal breast cancer which is known to be highly and uniquely dependent on estrogen signaling. Specifically, we used an ER-positive cell line, MCF-7, wherein a super-enhancer of ESR1 gene has been shown to be occupied by the TF estrogen receptor alpha (ERα). With input of the ESR1 gene in the ‘Upstream regulatory analysis’ (parameters: Tissue Type: Mammary Gland, SE-Gene Linking Strategies: Closest active, FIMO: 1e-9 and Pathway Enrichment Threshold: FDR corrected p-value < 0.001), the output table predicted that the SEs associated with ESR1 gene were indeed occupied by estrogen receptor ERα in almost all ER-positive breast cancer cell lines. Moreover, ERα was further identified as a master TF in multiple ER-positive breast cancer cell lines, along with other well-established ERα interacting TFs, such as XBP1, FOXA1 and GATA3.
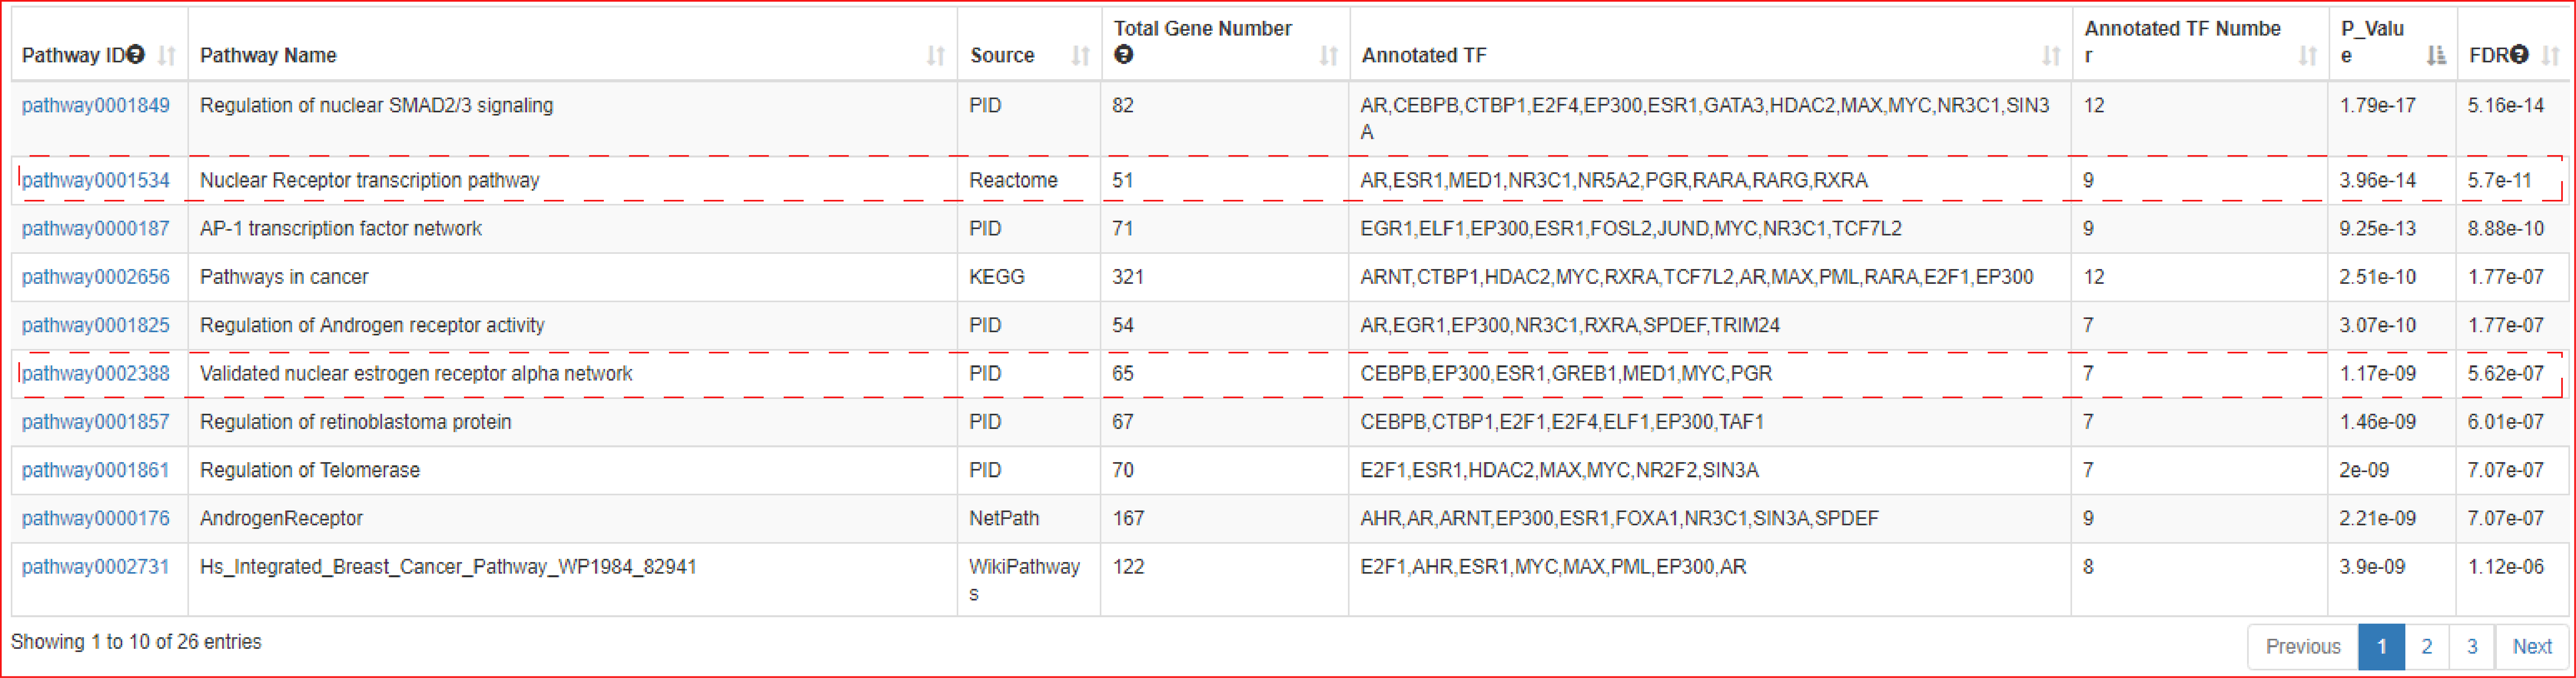
In the next step of prediction of enriched pathways, the webserver identified that the TFs associated with this ESR1 SE were significantly enriched in pathways including ‘Nuclear receptor transcription pathway (ranked 2nd of all pathways, Hypergeometric test; FDR corrected p-value = 5.7e-11)’ and ‘Validated nuclear estrogen receptor alpha network (ranked 6th of all pathways, Hypergeometric test; FDR corrected p-value = 5.62e-07)’. These predictions are congruent with the key role of ERα in mediating nuclear estrogen receptor signaling to the regulation of super-enhancer activity in luminal breast cancer.
Reference
Hnisz, D., Schuijers, J., Lin, C.Y., Weintraub, A.S., Abraham, B.J., Lee, T.I.,
Bradner, J.E. and Young, R.A. (2015) Convergence of developmental and oncogenic
signaling pathways at transcriptional super-enhancers. Molecular cell, 58,
362-370.
3.How to use the "Search"?
URL: http://licpathway.net/SEanalysis/search.do
SEanalysis supports five different searching modes: "searching by super-enhancer", "searching by sample", "searching by TF", "searching by pathway" and "searching by gene".
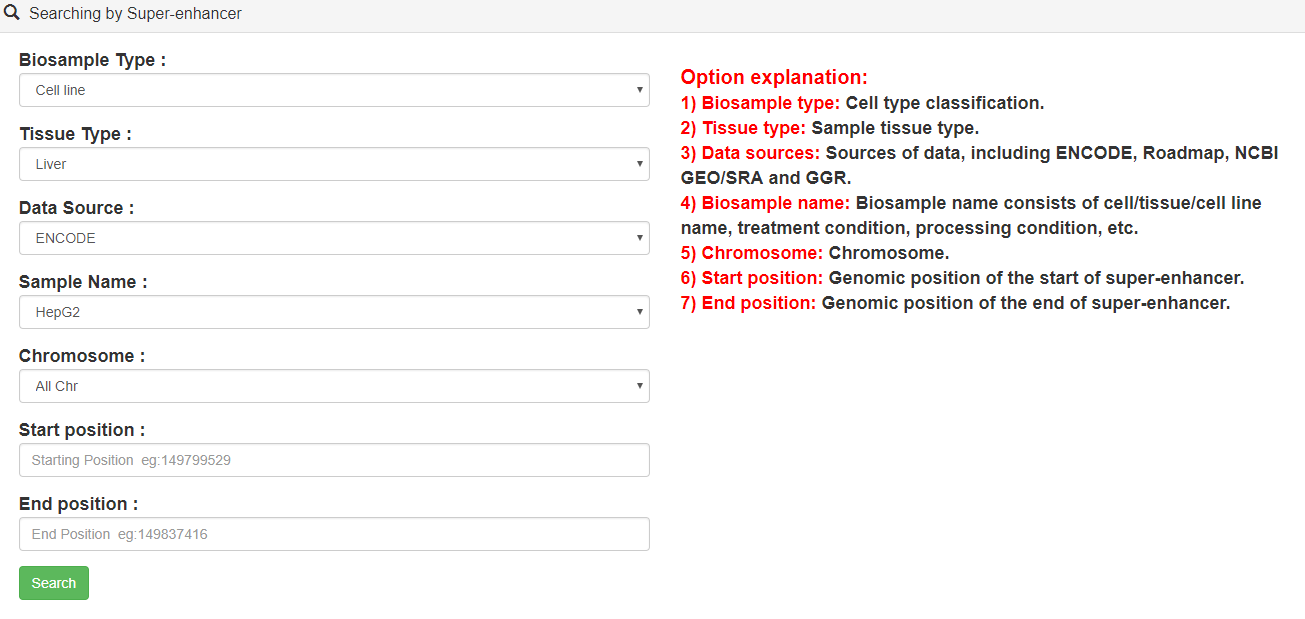
3.1.Searching by Super-enhancer
Users can query by selecting samples and genome locations of interest. Brief information of the search results is displayed in a table on the results page.
As an example, users can click Search→ENOCDE→Cell line→Liver→HepG2→chr1, the search results will be displayed on the next page.
The "Super-enhancer search result" page shows sample information, software parameters, SEs table, and visualization of master TF network.
The SEs table contains SE genomic regions and associated statistics. Our web server also supports the analysis of these SEs by online tools GREAT.
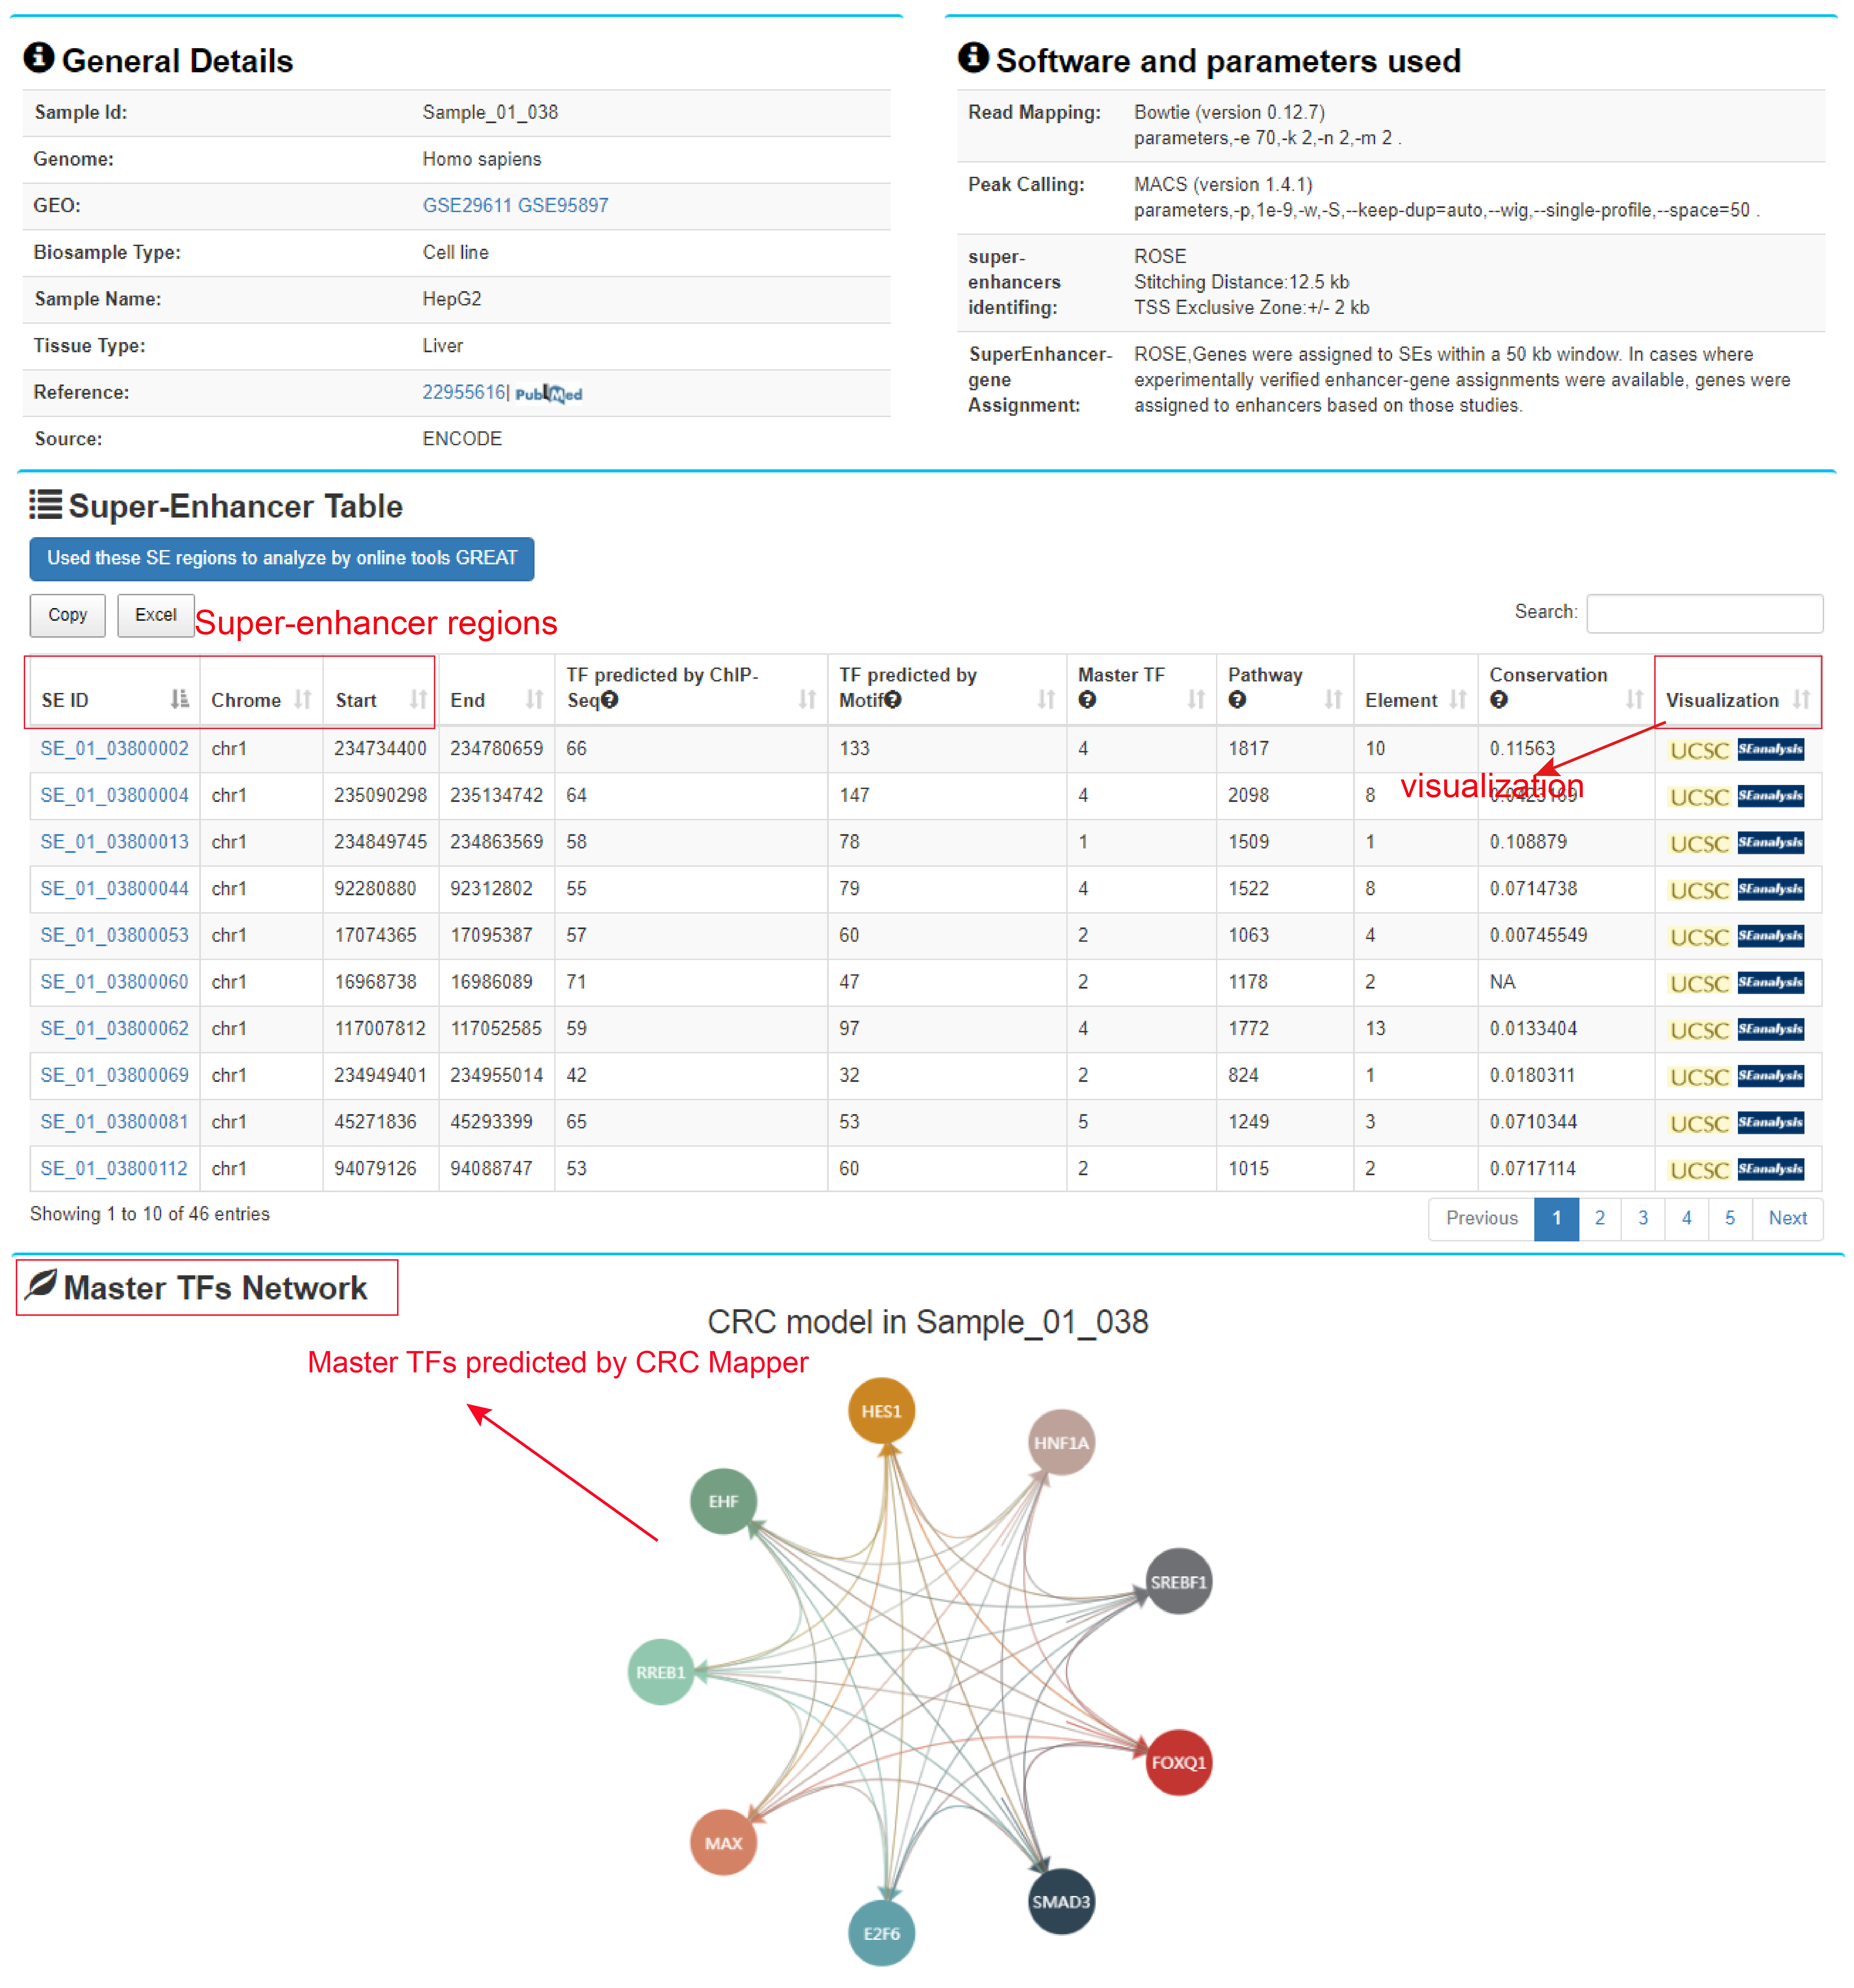
Users can click the "SE ID" button to view the detailed information, including general information of the SE, SE-associated genes, TFs binding to SE (identified by ChIP-seq experiments or predicted by motif analysis) and their upstream pathways. Users can also visualize the complex regulatory network.
3.2.Searching by sample
Users can query by selecting samples. Brief information on the search results is displayed in a table on the results page.
3.3.Searching by TF
Users can query by selecting sample, TF class and at least one TF of interest.
The resultant "TF result" page includes sample information, software parameters and TFs table.

Users can further click any TF and view its details, including their upstream pathways, the number of SEs bound by this TF and genes associated with these SEs. Users also can visualize the complex regulatory network.
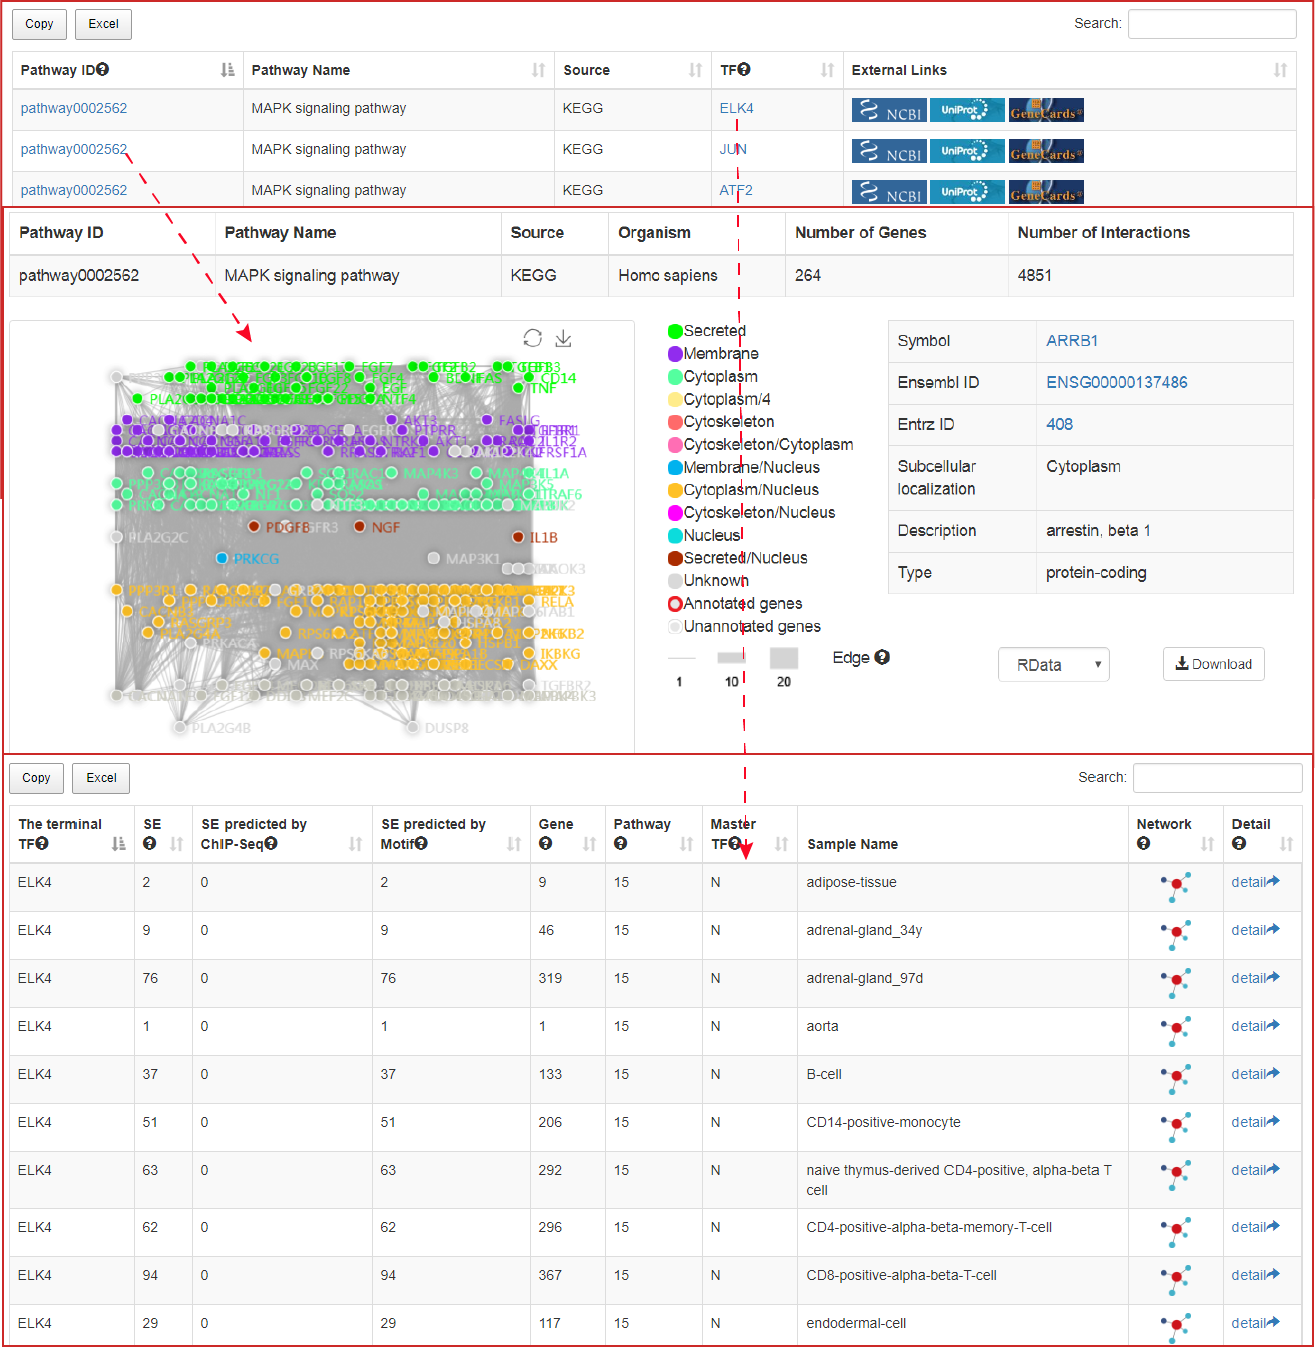
3.4.Searching by pathway
Users can query by selecting pathway sources and pathway names.
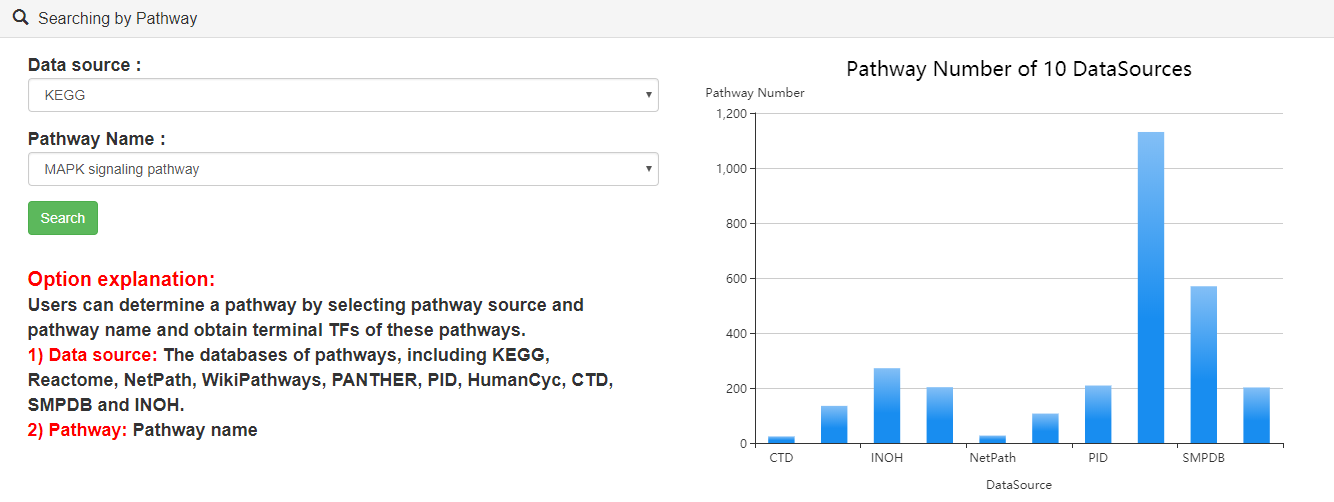
Users can click "search" button to identify the terminal TFs downstream of these pathways. Users can further click "pathway ID" to view the detailed information and the topological structure of current pathway.
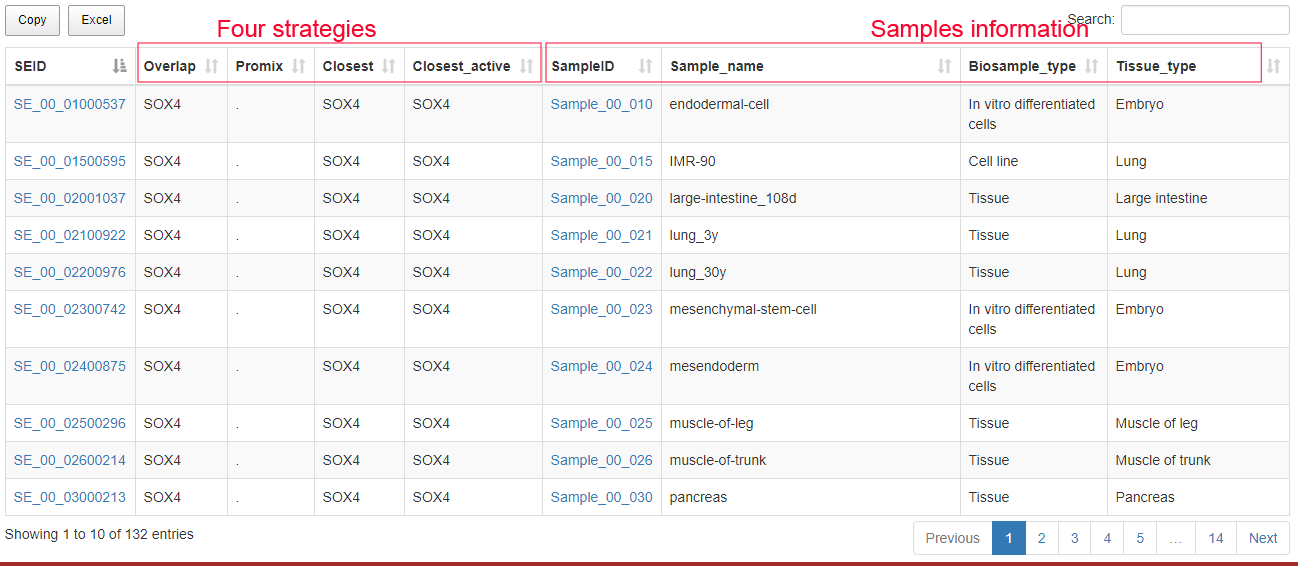
3.5.Searching by gene
Users can submit a gene symbol to search for its associated SEs. The results include four columns of SE-assigned genes annotated by four different strategies (ROSE overlap, ROSE proximal, ROSE closest and the closest active gene). The relationships between genes and upstream SEs, and the related information of the SEs will be shown.
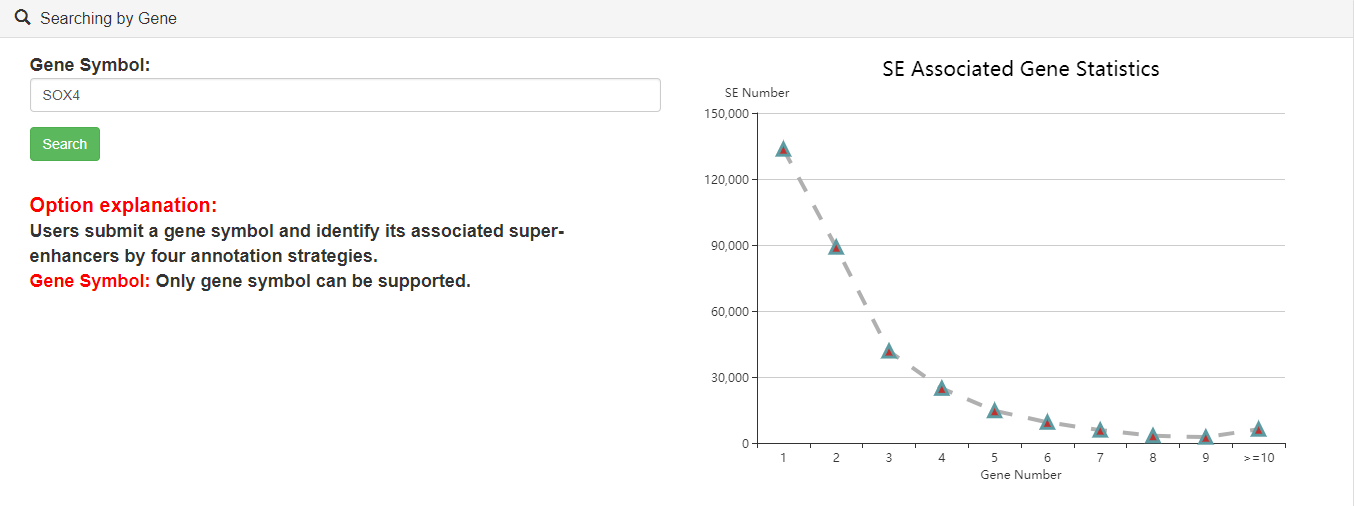
The result page:
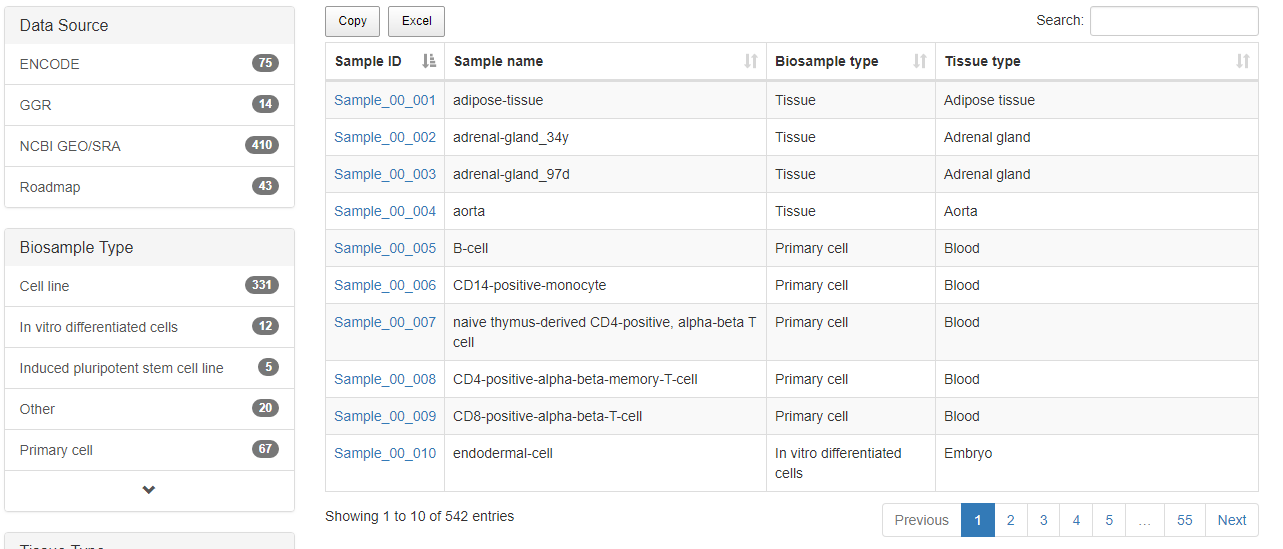
4.Browse
URL: http://licpathway.net/SEanalysis/browse.do
The "Browse" page is an interactive table with alphanumeric sorting function that allows users to quickly search samples and customize filters through "Data sources", "Biosample type", "Tissue type", and "Biosample name" in the left panel. To view the SE for a given sample, users can click the "Sample ID" in the right table. "Search" box in the "Browse" page can also be used to identify samples of interest.
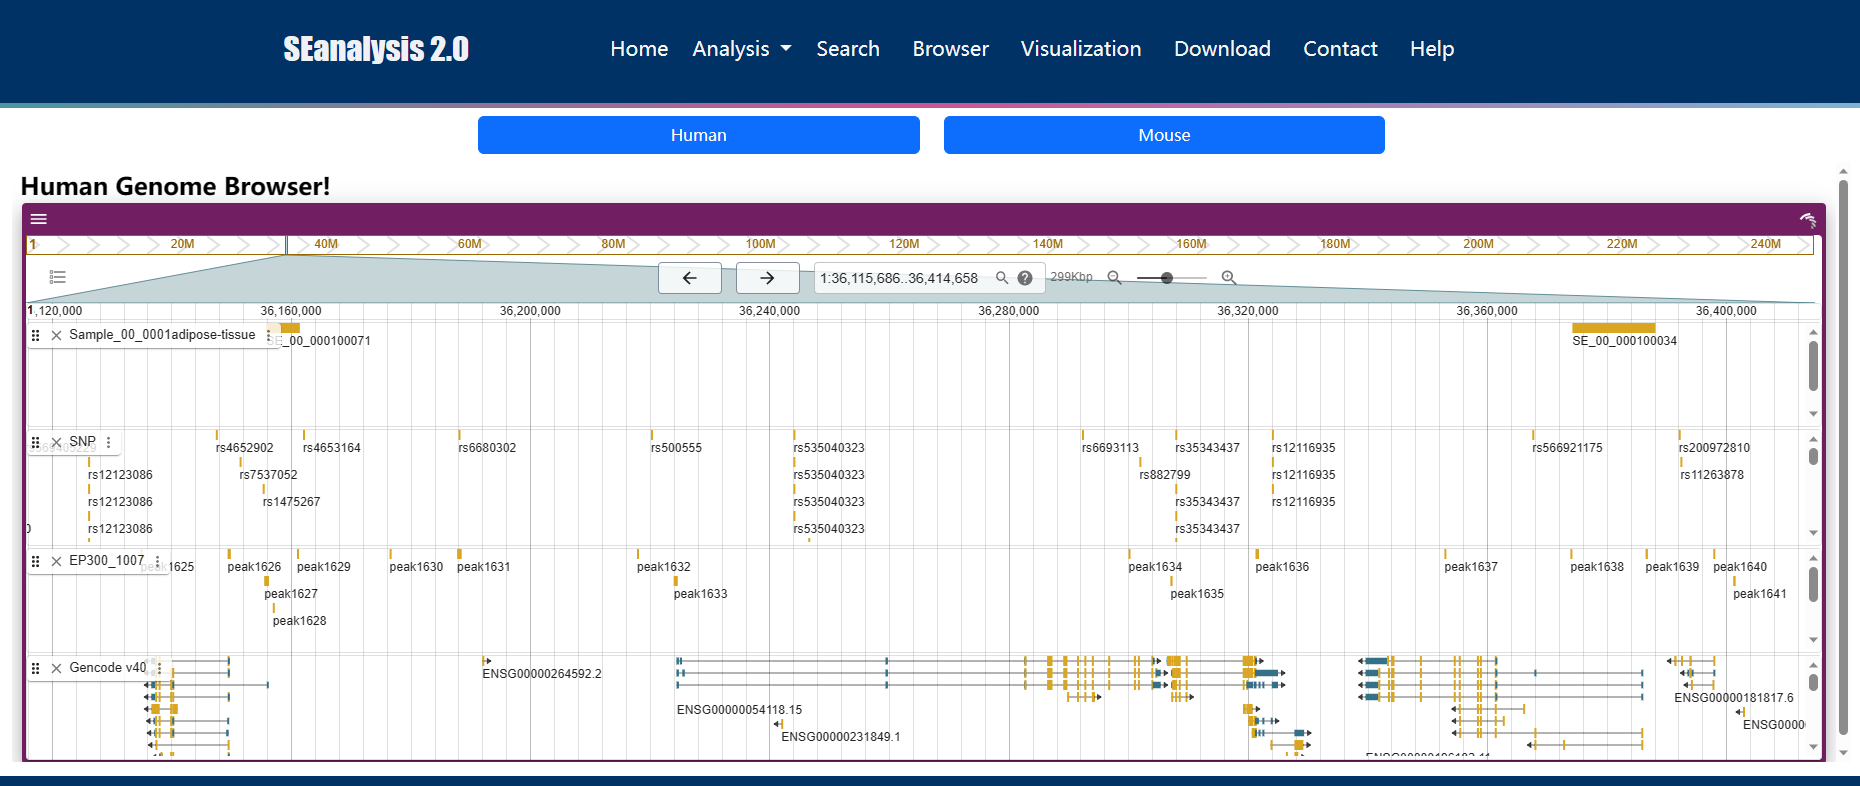
5.Visualization
URL: http://licpathway.net/SEanalysis/visualization/
To help users view SEs along the genome, we developed a customizable genome browser using JBrowse with more than 6,000 tracks. Users can view the genomic locations of SEs, TFBS identified by ChIP-seq, SNP, DHSs, and conservative score.
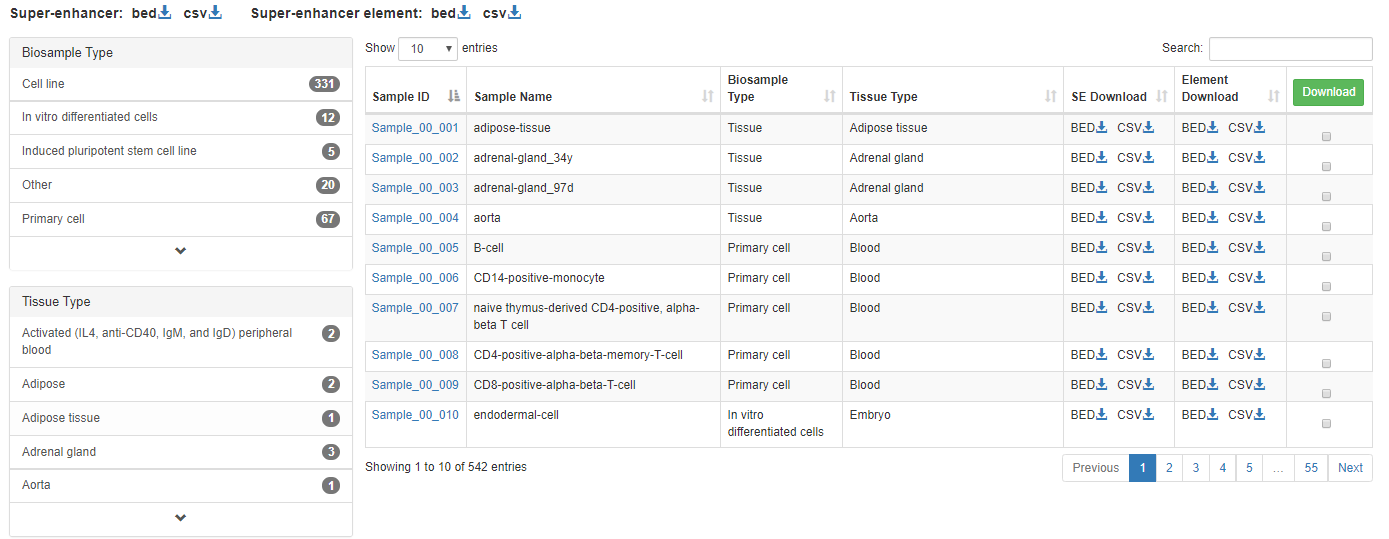
6.Download
URL: http://www.licpathway.net/SEanalysis/download.do
The data of SEs and SE elements of all samples can be downloaded in the "Download" page. We support ".bed" and ".csv" formats.
7.TF Class
We first manually assigned four generic level classification (superclass, class, family and subfamily) of the TFs according to TFClass database, which aims for classifying eukaryotic transcription factors (TFs) according to their DNA-binding domains. For superclass and class, users can browse the number of TFs in each classification by the tree view. In addition, we also classified TFs that were not classified by TFClass according to the TcoF-DB, including TcoF-DB_TF and TcoF-DB_Tcof. Finally, the rest of TFs were classified as ENCODE_TF according to ENCODE or UNKNOW.
8.Data Source
In SEanalysis 2.0, the H3K27ac samples has been significantly expanded. SEanalysis 2.0 includes 1 739 human samples and 931 mouse samples. Human SEs were increased from ~330 000 to 1 167 518 and 550 226 mouse SEs were newly added. Meanwhile, the human TFs involved increased from 1 044 to 1 700, and newly added 755 mouse TFs.