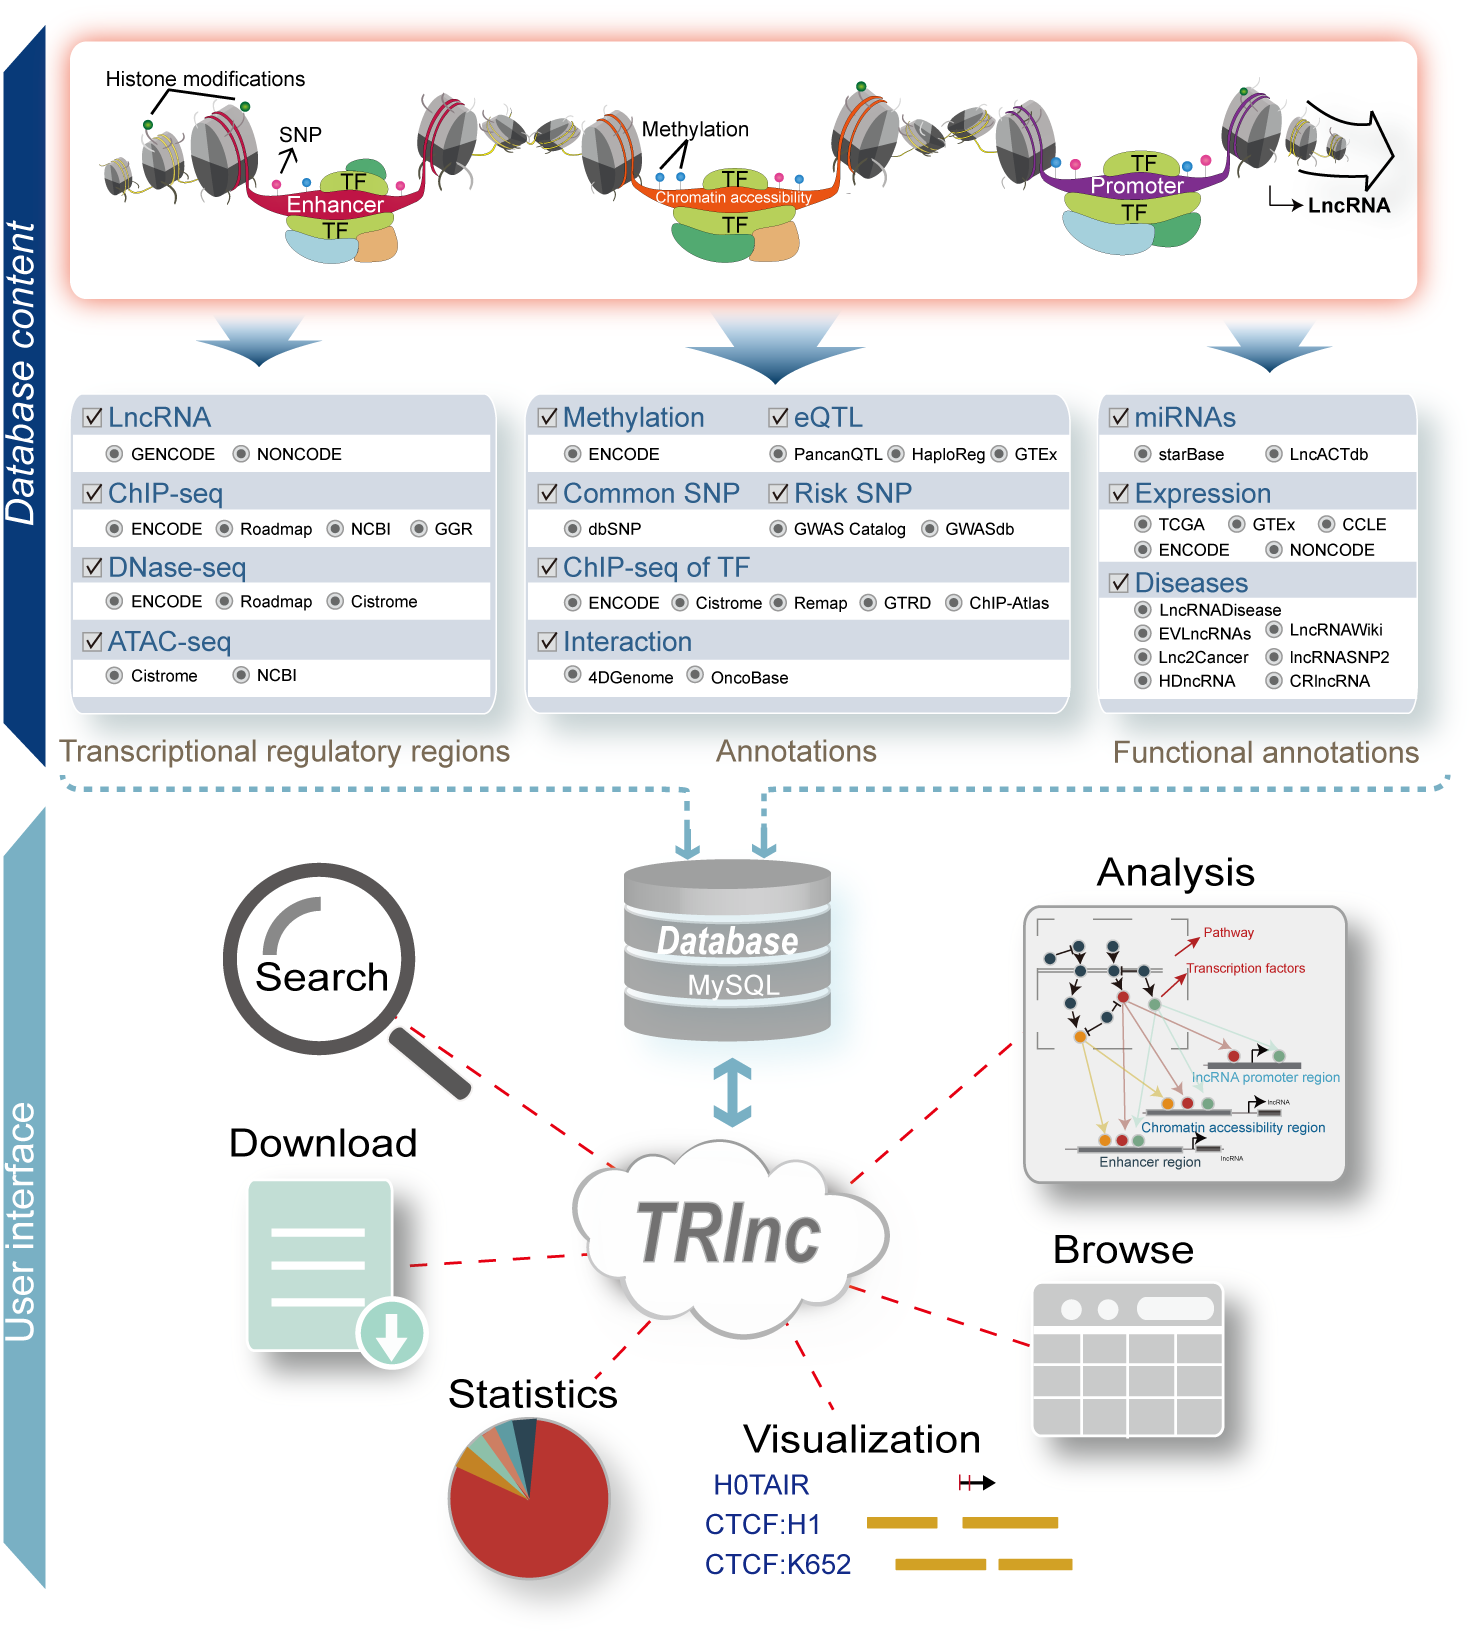
1. Introduction
Here, we developed a comprehensive database of human transcriptional regulation of lncRNAs (TRlnc, http://www.licpathway.net/TRlnc), which aims to collect a large number of available resources of transcriptional regulatory regions of lncRNAs, and to annotate and illustrate their potential roles in the regulation of lncRNAs in cell type-specific manner. The current version of TRlnc contains 8,683,028 typical enhancers/super-enhancers and 32,348,244 chromatin accessibility regions associated with 91,906 human lncRNAs. These regions were identified from over 900 human H3K27ac ChIP-seq, ATAC-seq and DNase-seq samples. Furthermore, TRlnc provides the detailed (epi) genetic information in transcriptional regulatory regions (promoter, enhancer/super-enhancer and chromatin accessibility regions) of lncRNAs, including common SNPs, Risk SNPs, eQTLs, Linkage disequilibrium SNPs, TFs predicted by motifs, TFs identified by ChIP-seq, methylation sites of 450K array, methylation sites of whole-genome shotgun bisulfite sequencing, histone modifications and 3D chromatin interactions, especially supporting the display of TFs binding to transcriptional regulatory regions from over 7,000 TF ChIP-seq samples. In addition, TRlnc integrates expression, diseases and miRNAs associated with lncRNAs from multiple sources, please see the ‘Statistics’ page.
2. How to use the "Search"?
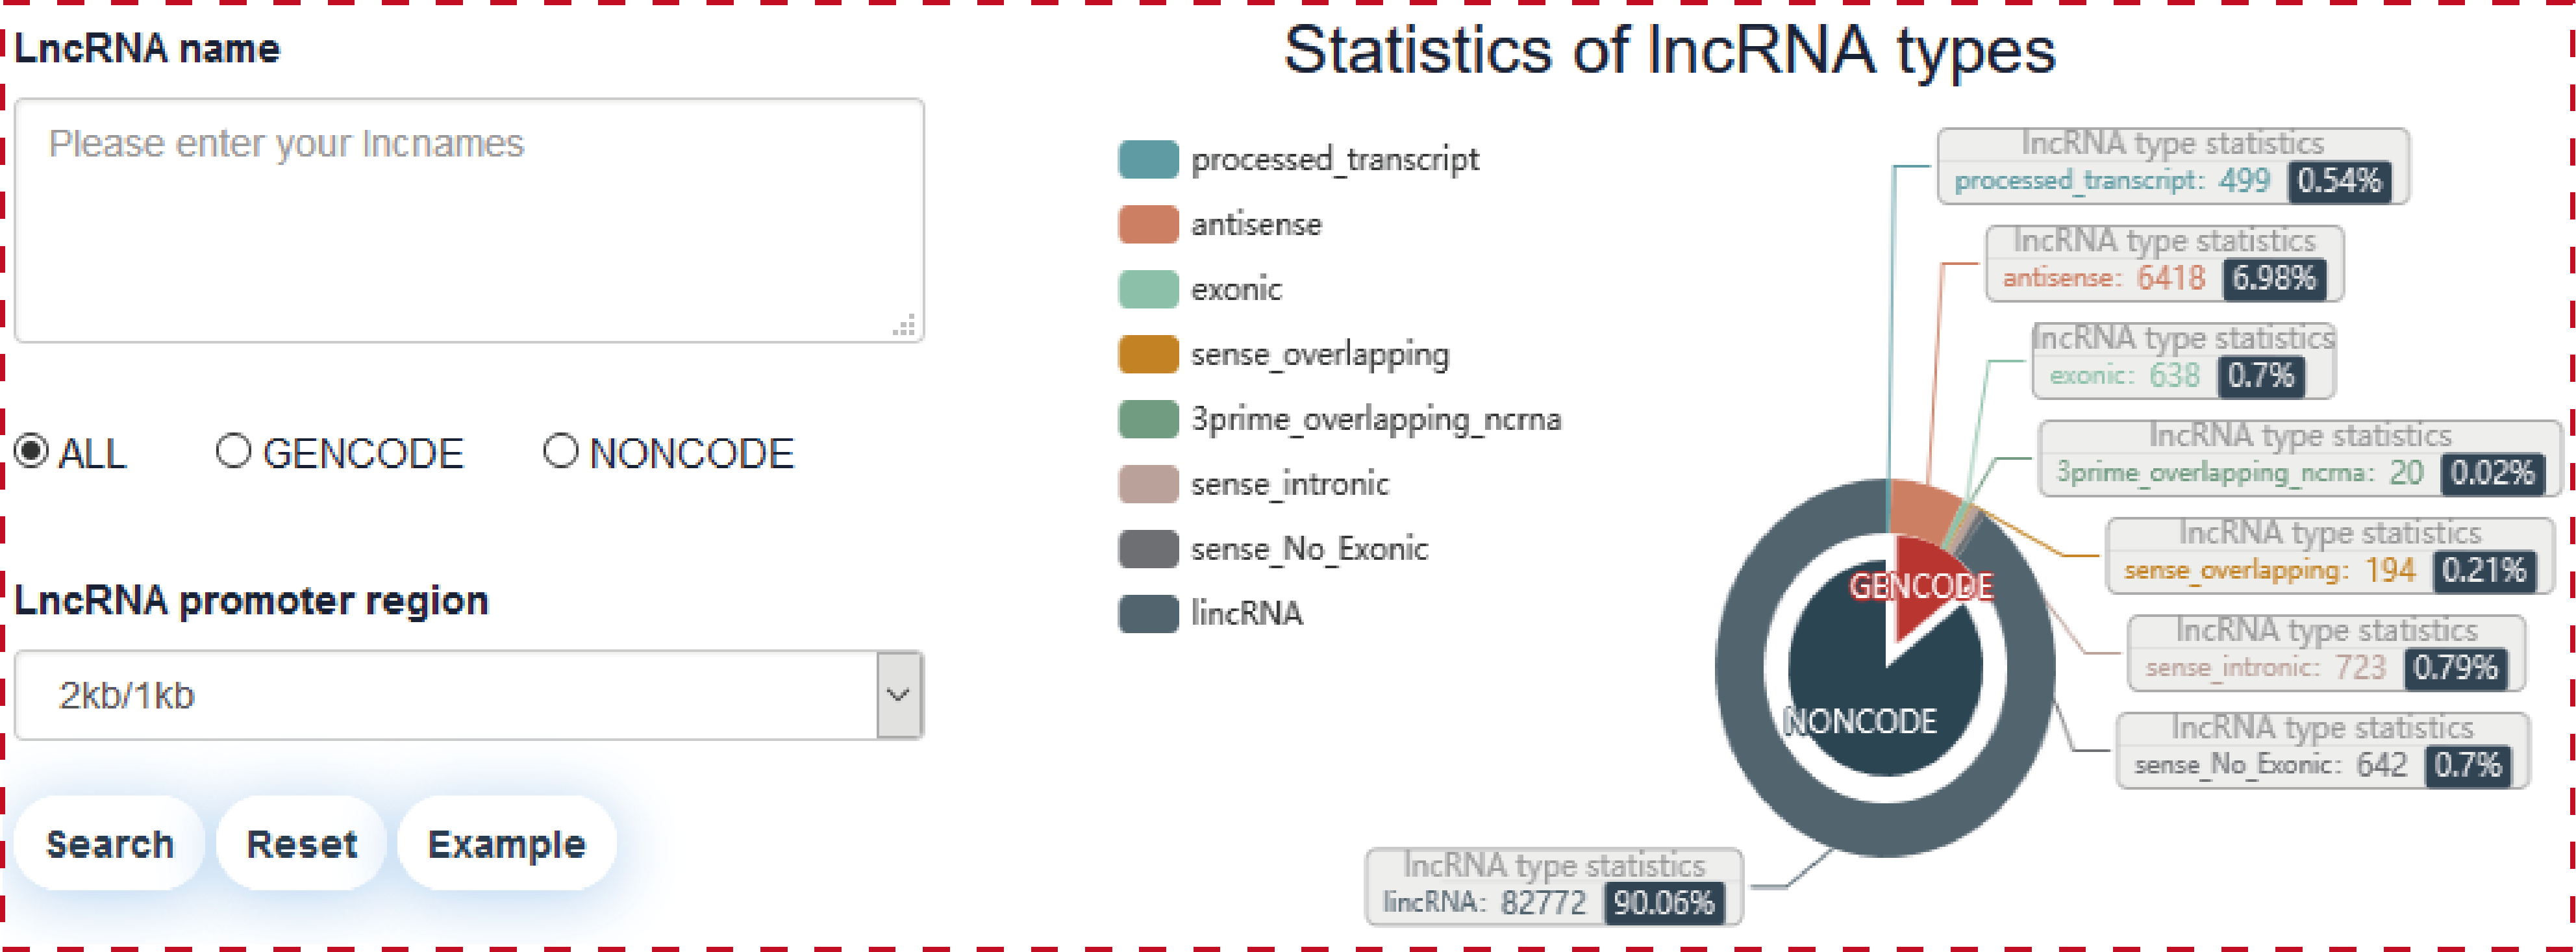
Users can search transcriptional regulatory information of lncRNAs through five paths, including ‘Search by lncRNA’ (input lncRNA name(s) of interest), ‘Search by TF’ (input TF name and sample), ‘Search by SNP’ (input SNP ID), ‘Search enhancer associated lncRNAs by genomic region’ (input genomic position and sample), ‘Search chromatin accessibility associated lncRNAs by genomic region’ (input genomic position and sample). Users can further select ‘lncRNA source’ and ‘promoter regions’ for customizing filters in ‘Search’ page.
Users can query by inputing lncRNA names of interest, lncRNA source and promoter region, the search result will be displayed on the next page.
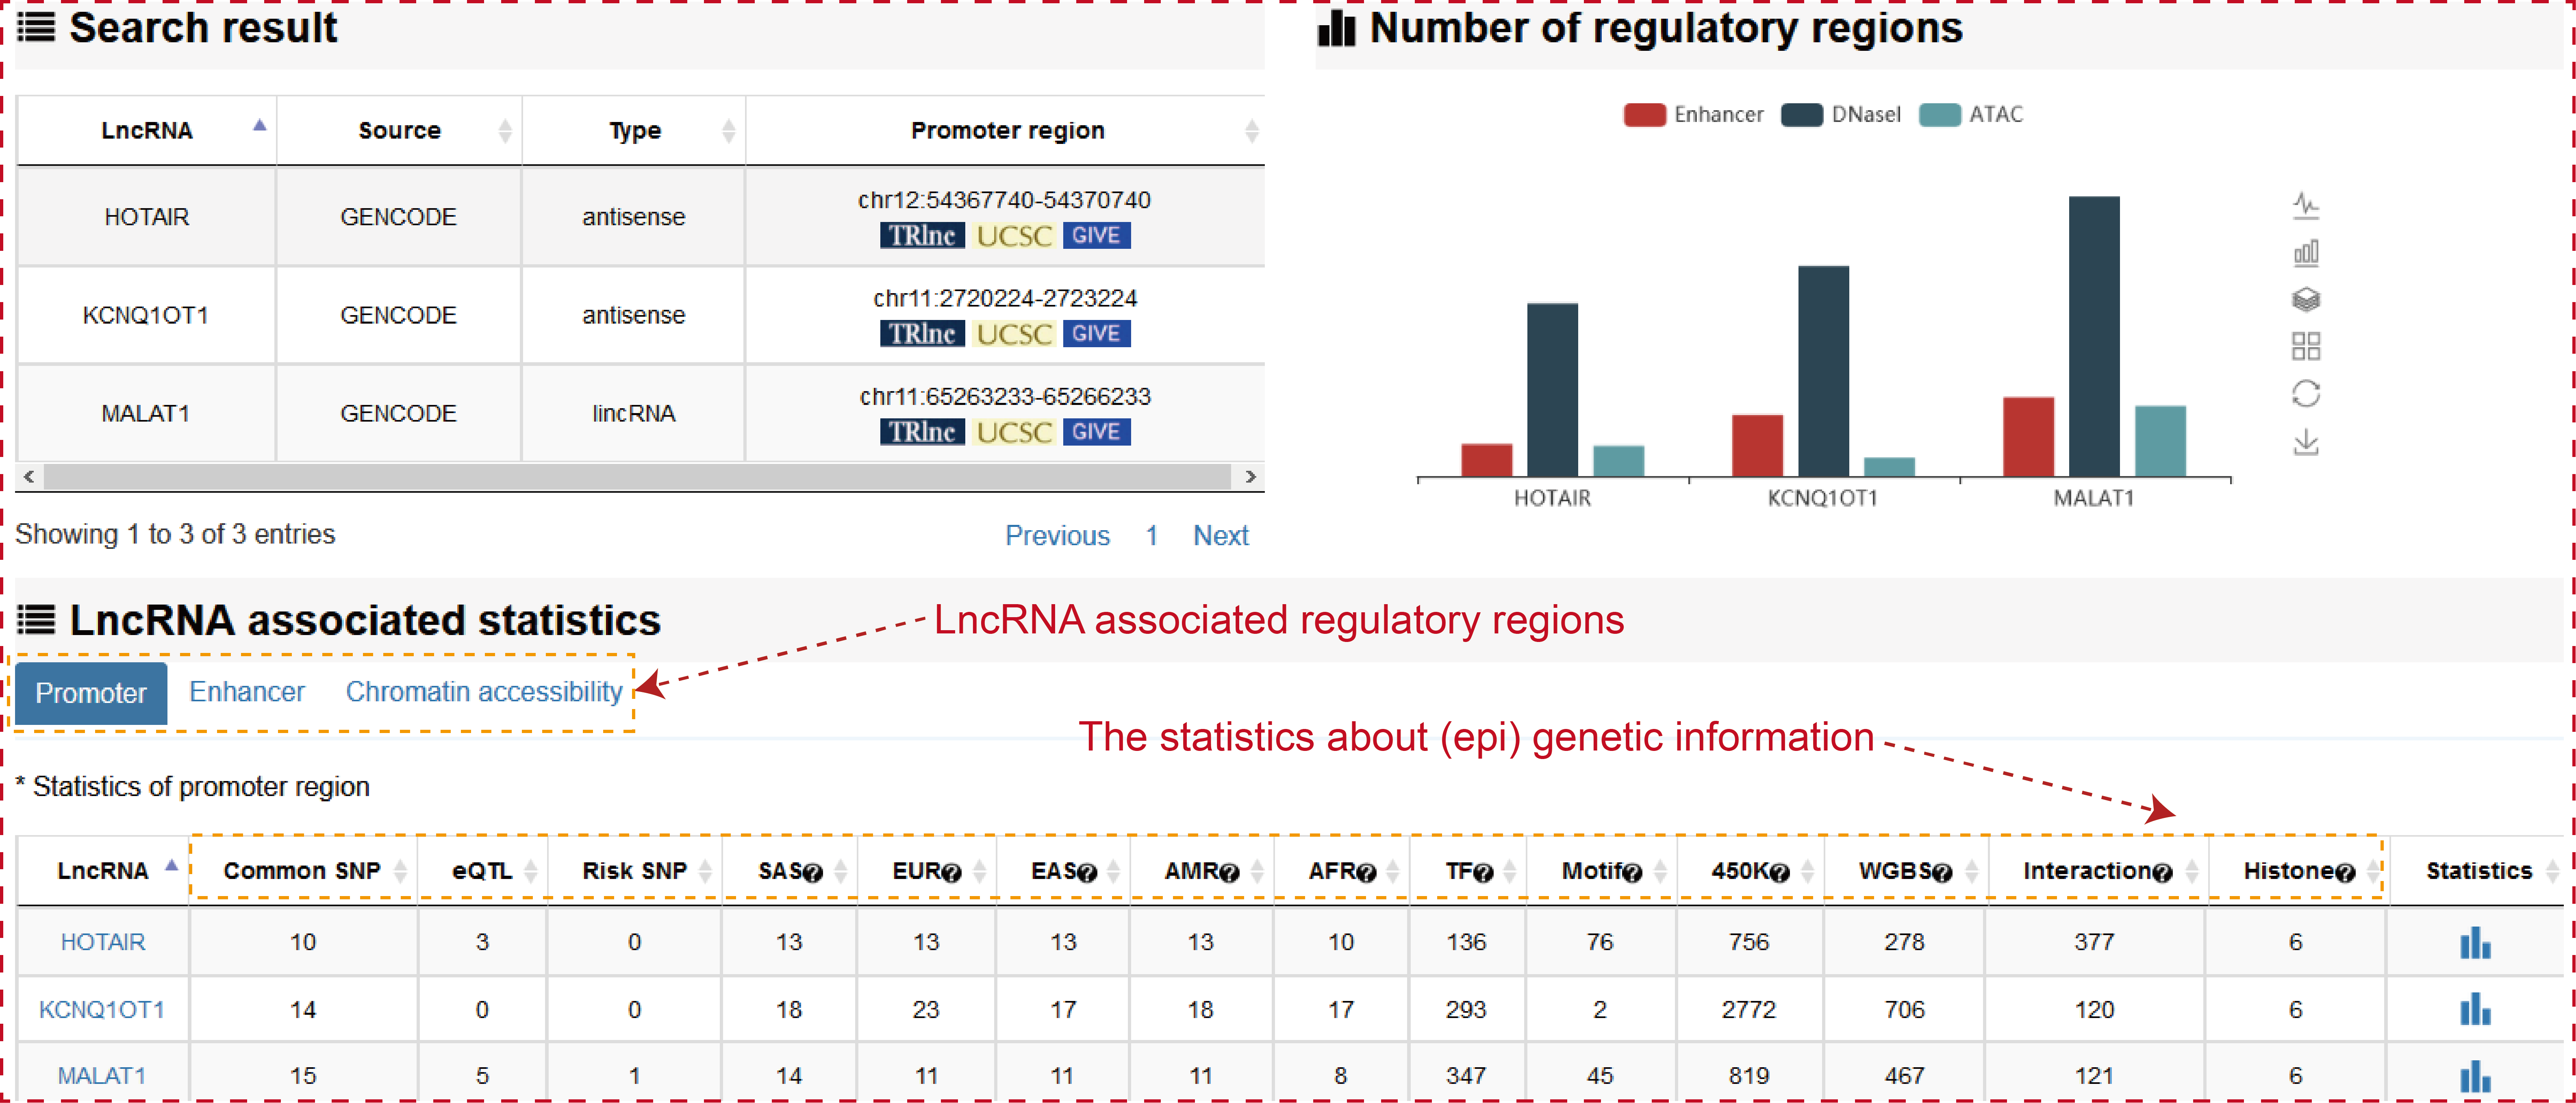
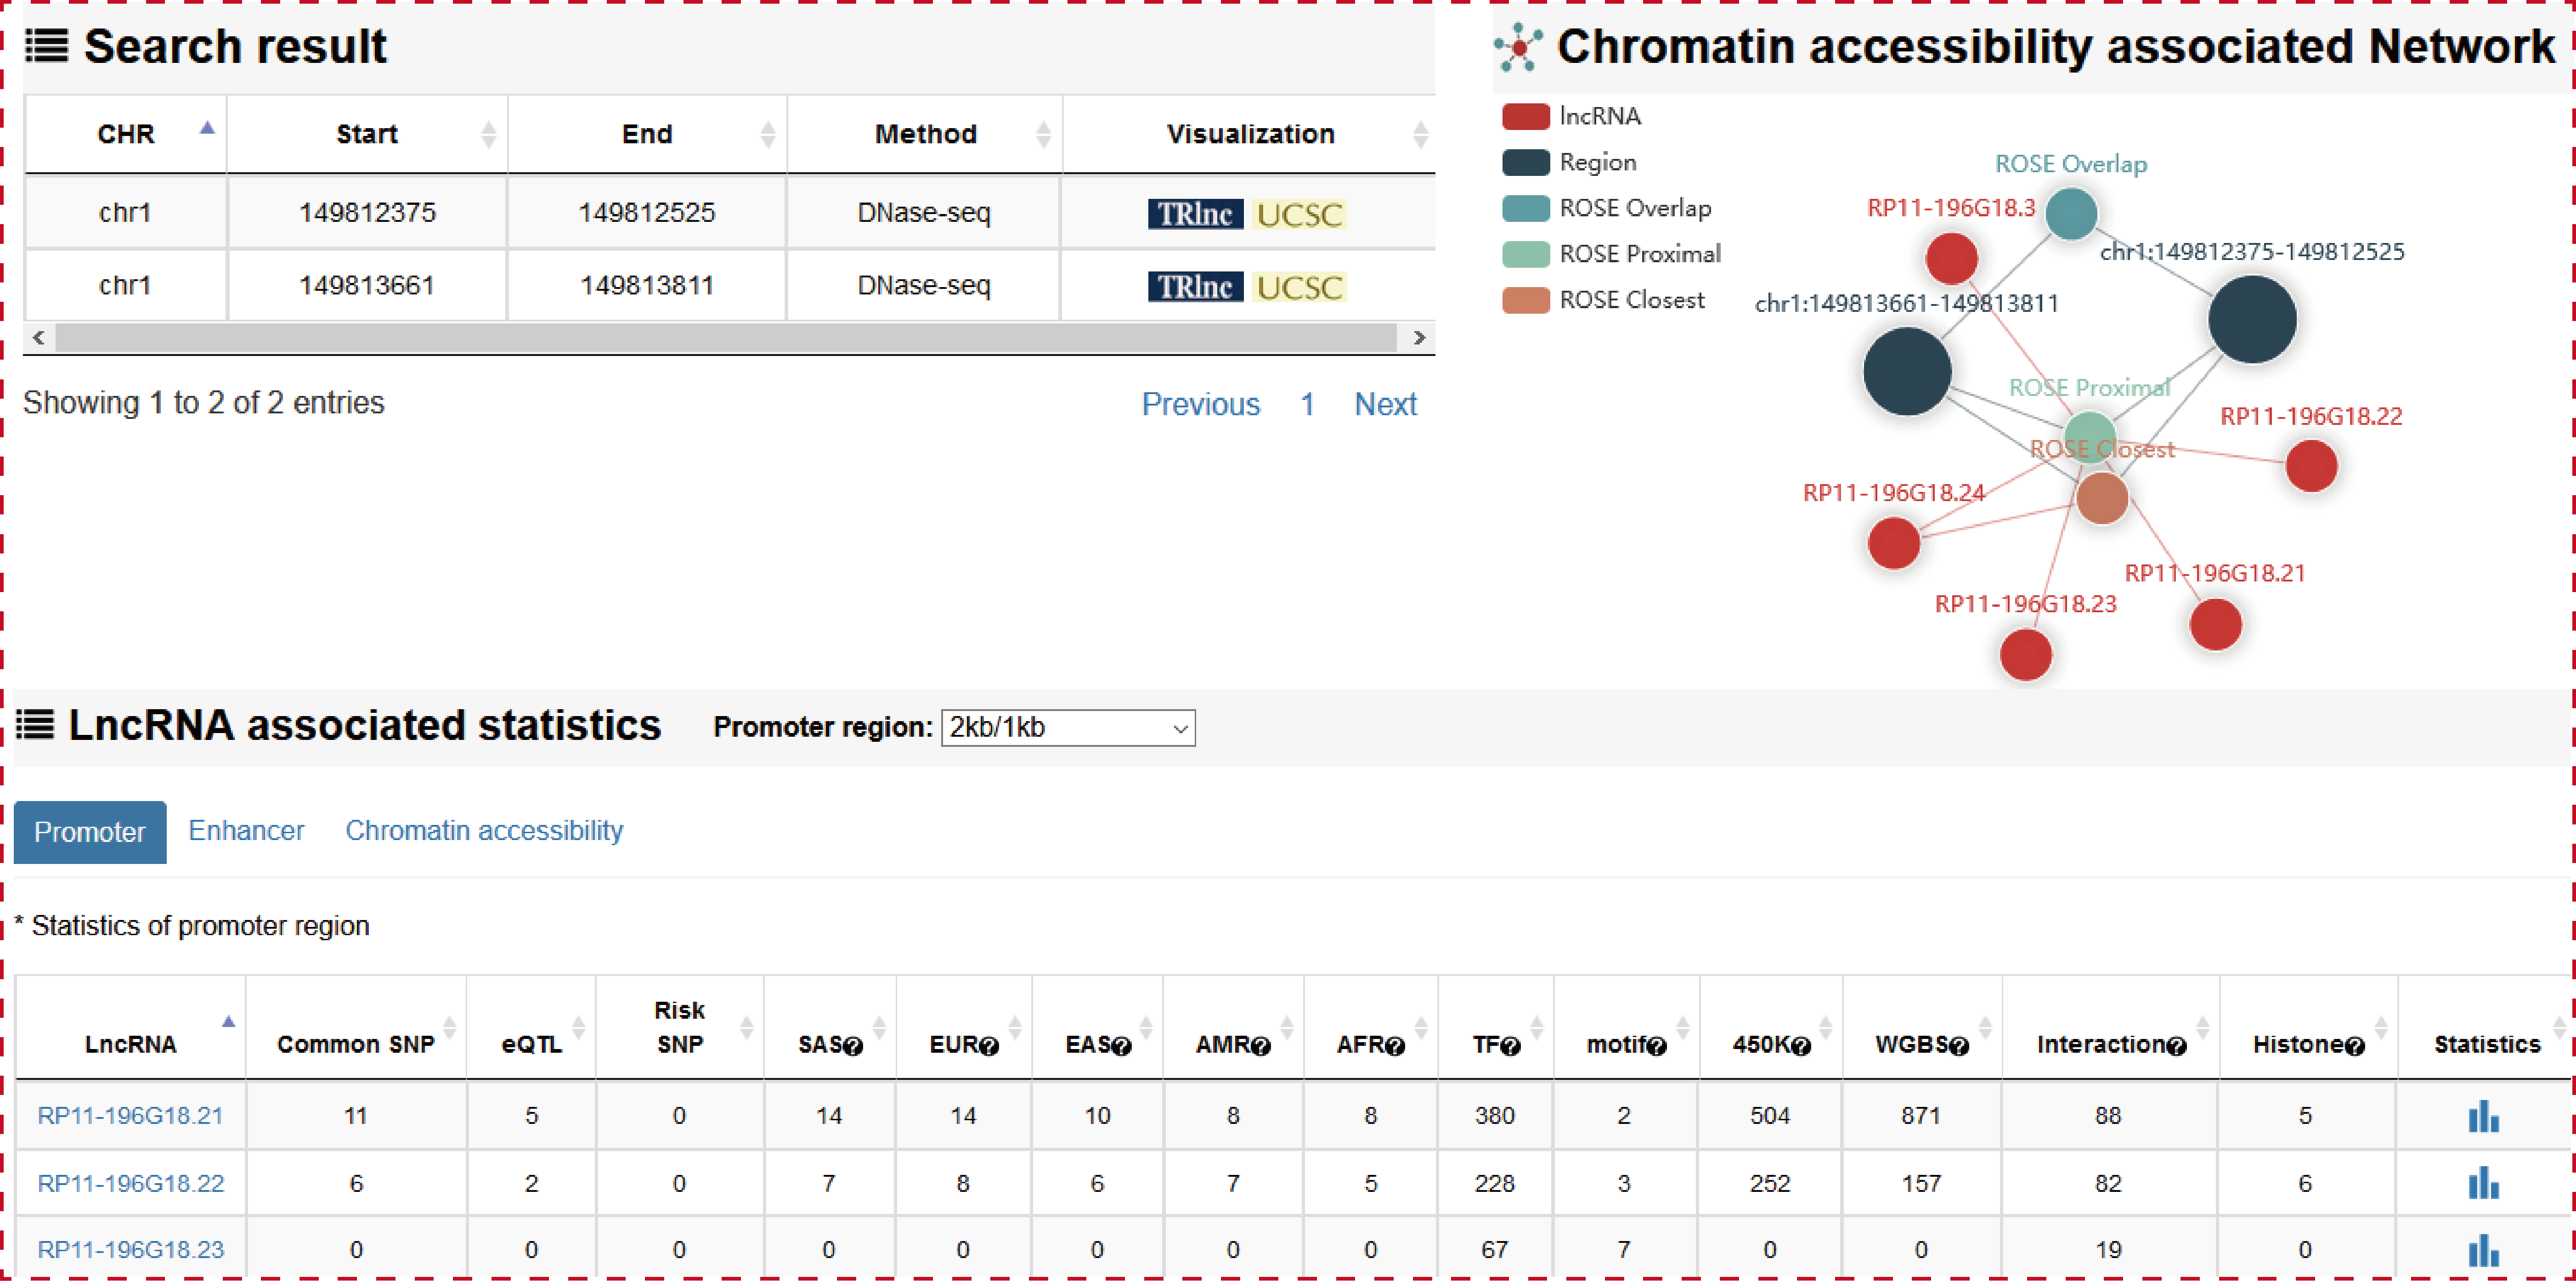
The ‘search result’ page shows lncRNA general information, the number of lncRNA associated regulatory regions and the statistics about (epi) genetic information in transcriptional regulatory regions. The (epi) genetic information including common SNPs, Risk SNPs, eQTLs, African Population LD, American Population LD, East Asian Population LD, European Population LD, Sout Asian Population LD, TFs predicted by motif, TFs identified by ChIP-seq, methylation sites of 450k array, methylation sites of whole-genome shotgun bisulfite sequencing, histone modifications and 3D chromatin interactions.
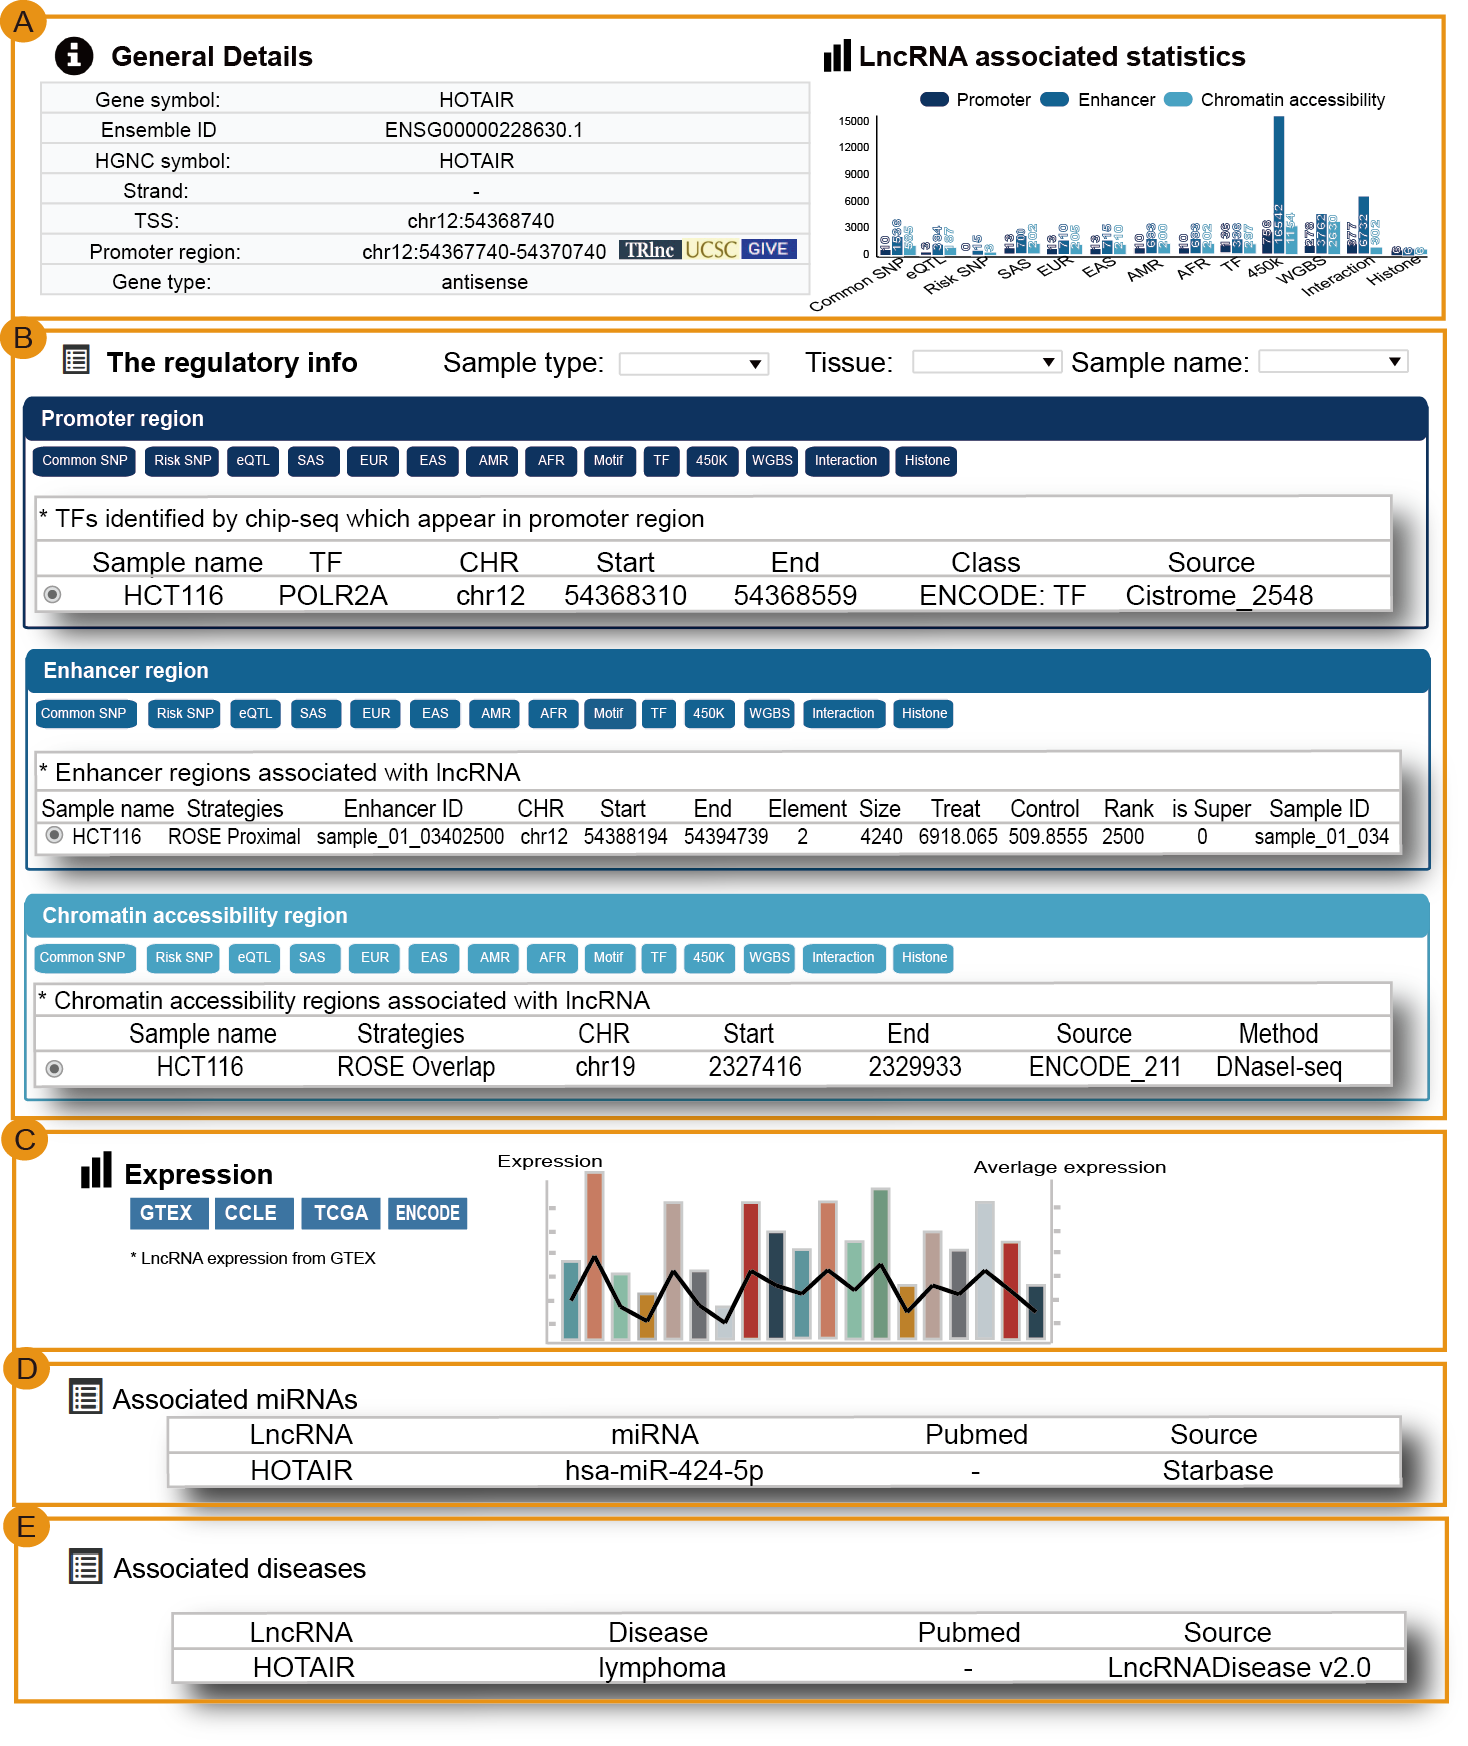
Users can click ‘LncRNA name’ of the table to view the details about each lncRNA. Besides the general details about the lncRNA, TRlnc shows the information of transcriptional regulatory regions including: I. Promoter region (genomic position), II. Enhancer region (Enhancer and lncRNA linking strategies, Enhancer ID, genomic position, Element, Size, rank, ChIP density, isSuper, Sample name, Sample ID) and III. Chromatin accessibility region (Linking strategies, genomic position, Sample name, Source), Notably, the more detailed annotation information within transcriptional regulatory regions are listed. For example, in the ‘Risk SNPs’ module of enhancer region, TRlnc provides the detailed (epi) genetic information about Risk SNPs within the enhancer region which is selected by user. Users can further change sample by selecting ‘Sample type’, ‘Tissue type’ and ‘Sample name’ for customizing filters.
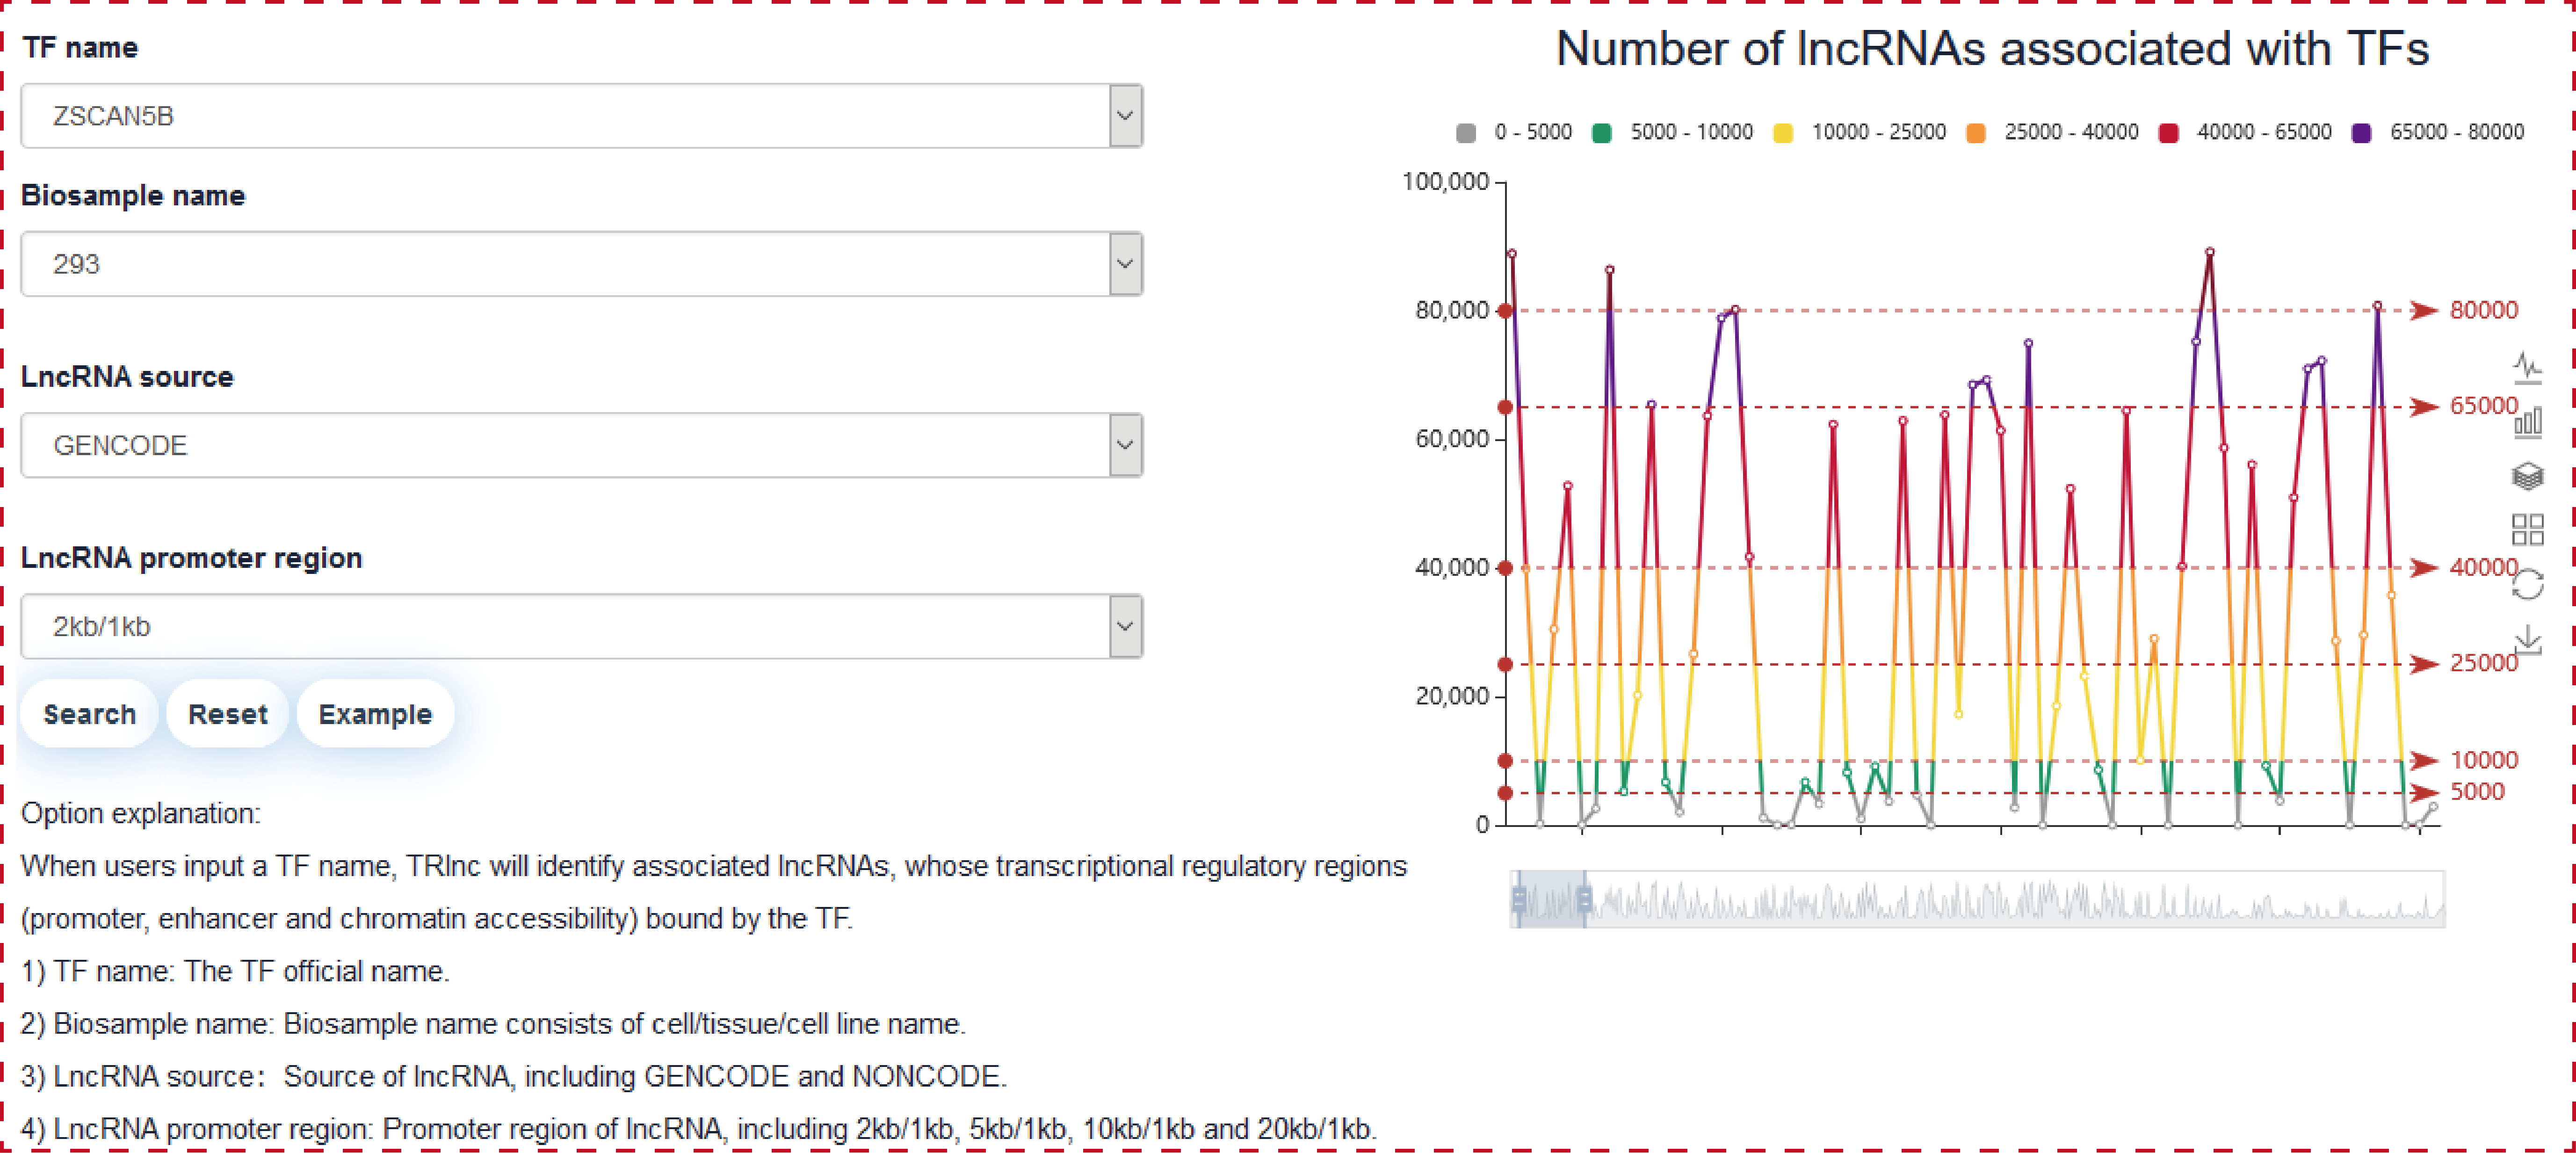
Users can query by inputing TF name of interest, lncRNA source and lncRNA promoter region, the search result will be displayed on the next page.
The ‘search result’ page shows TF general information, the statistics of (epi) genetic information in transcriptional regulatory regions and the network of TF associated lncRNAs in cell type-specific manner.
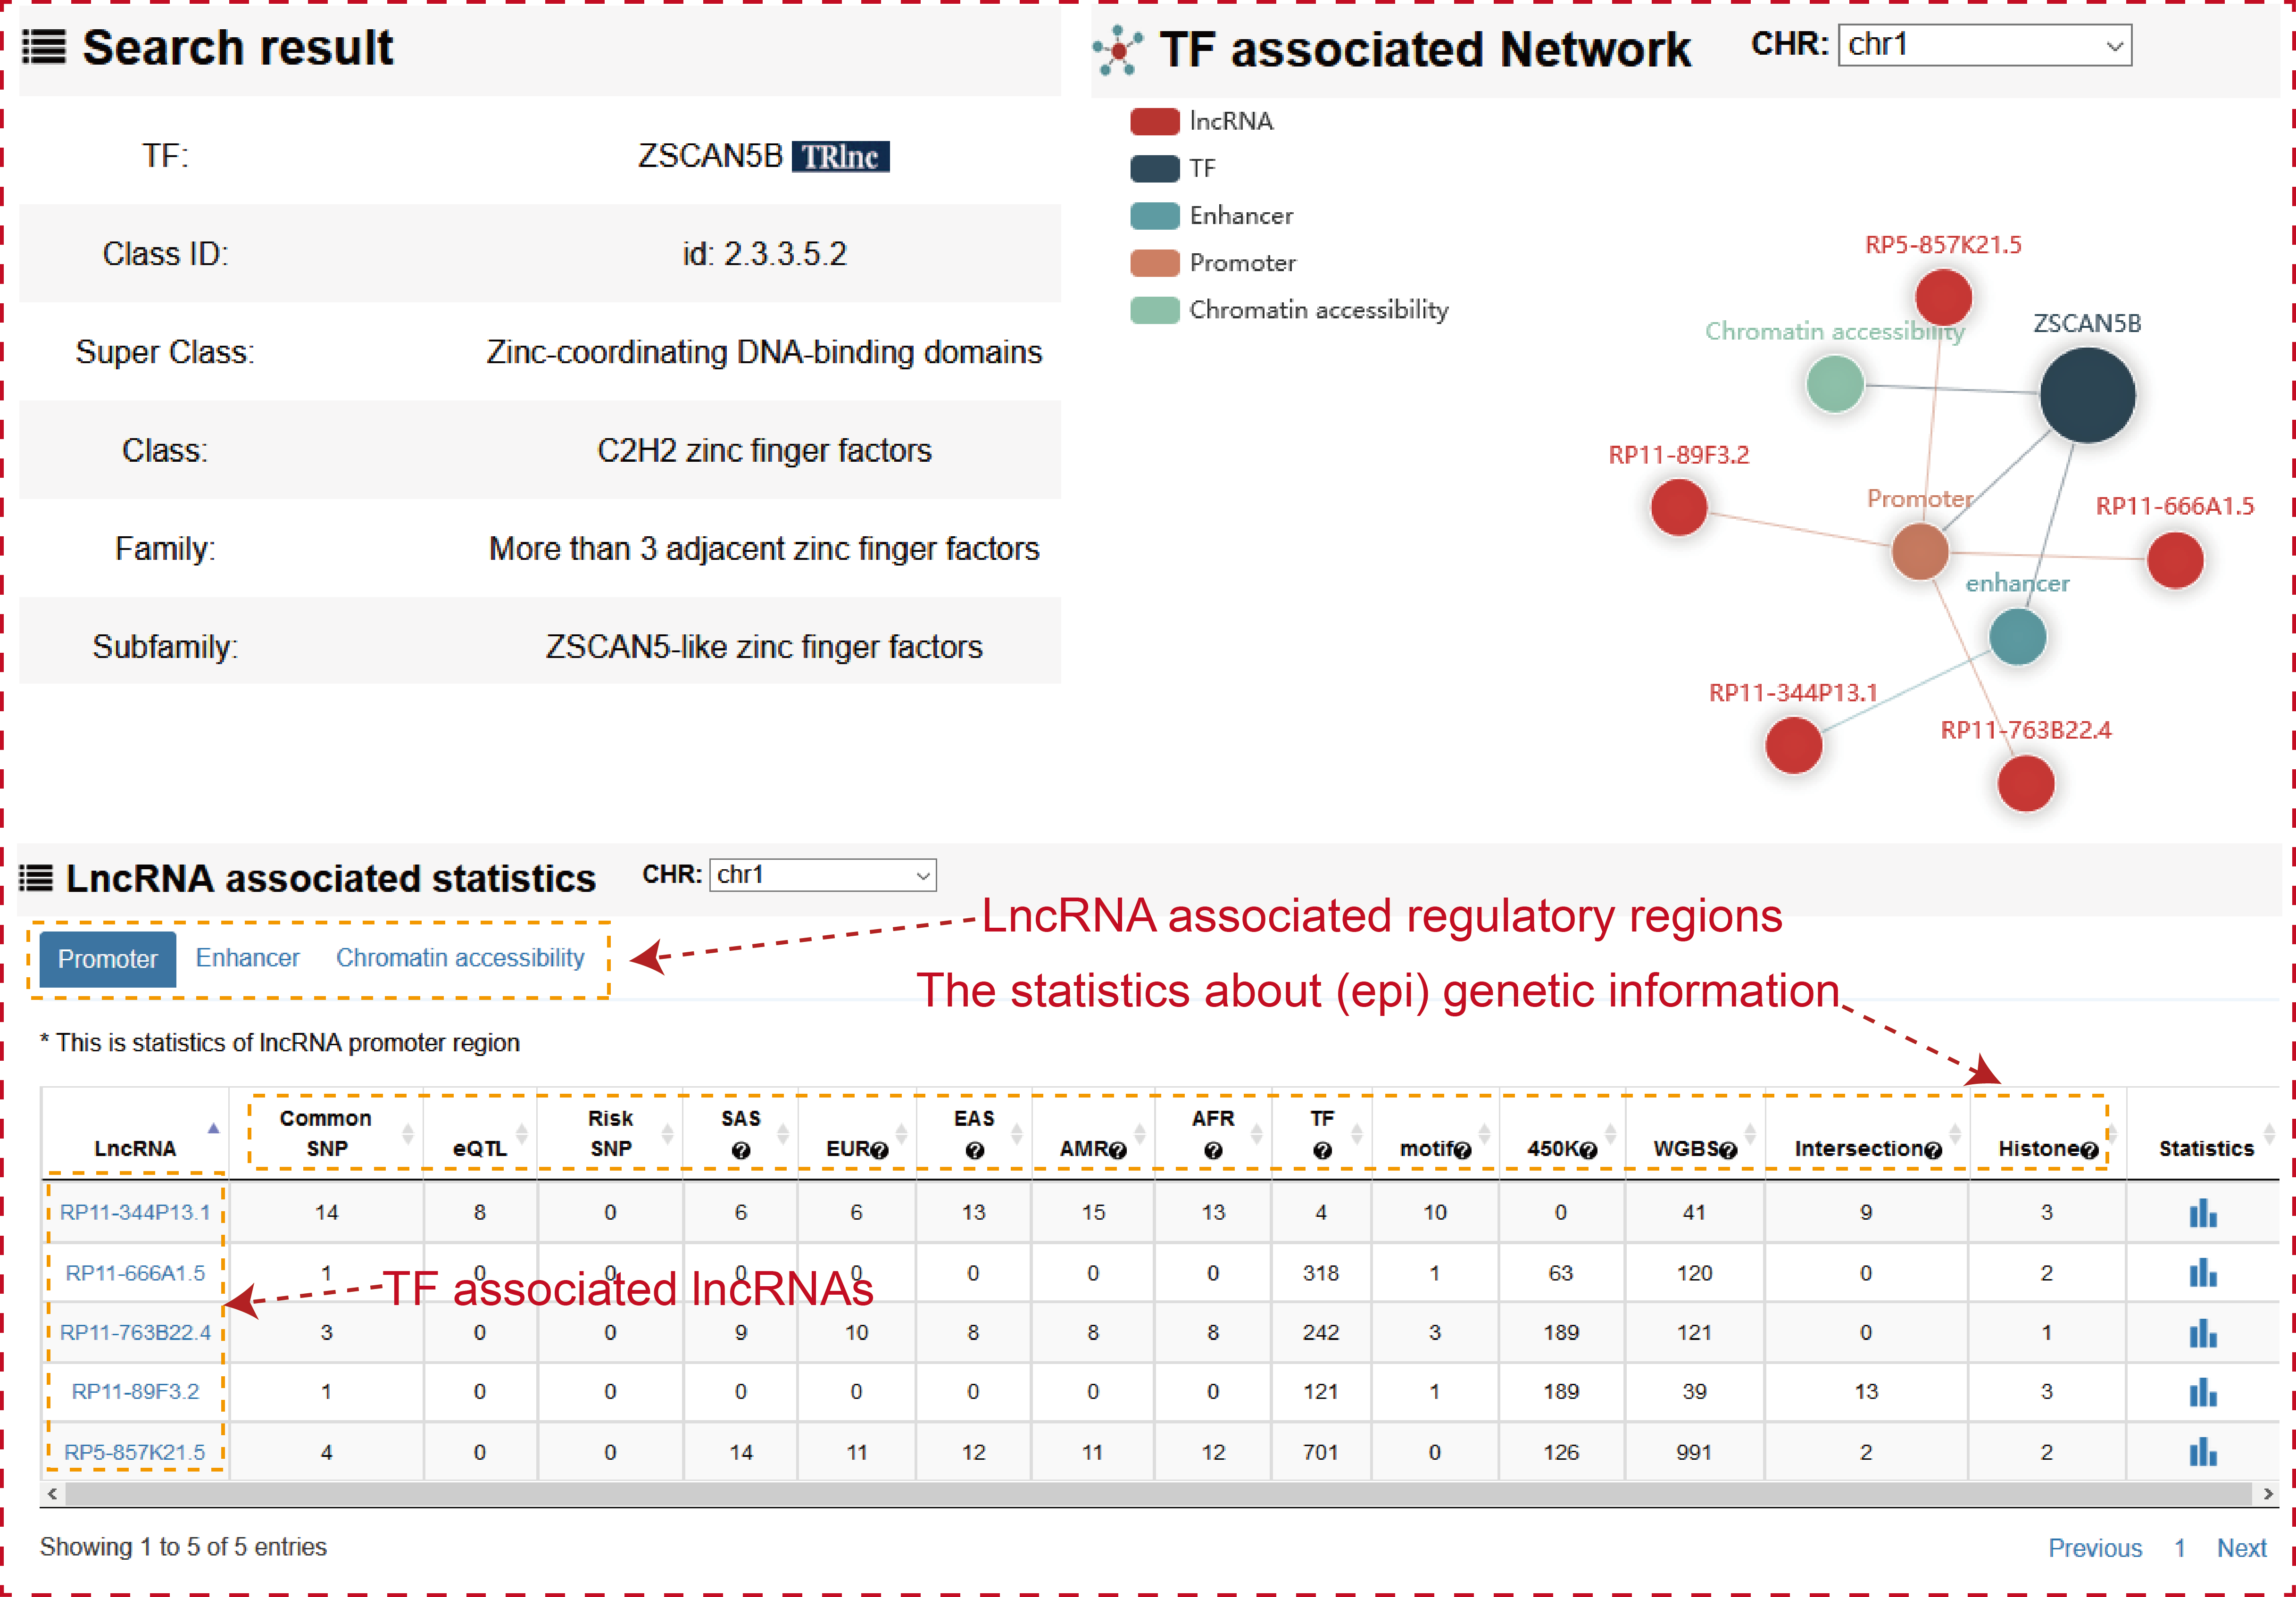
Users can click ‘LncRNA name’ of the table to view the details about each lncRNA.
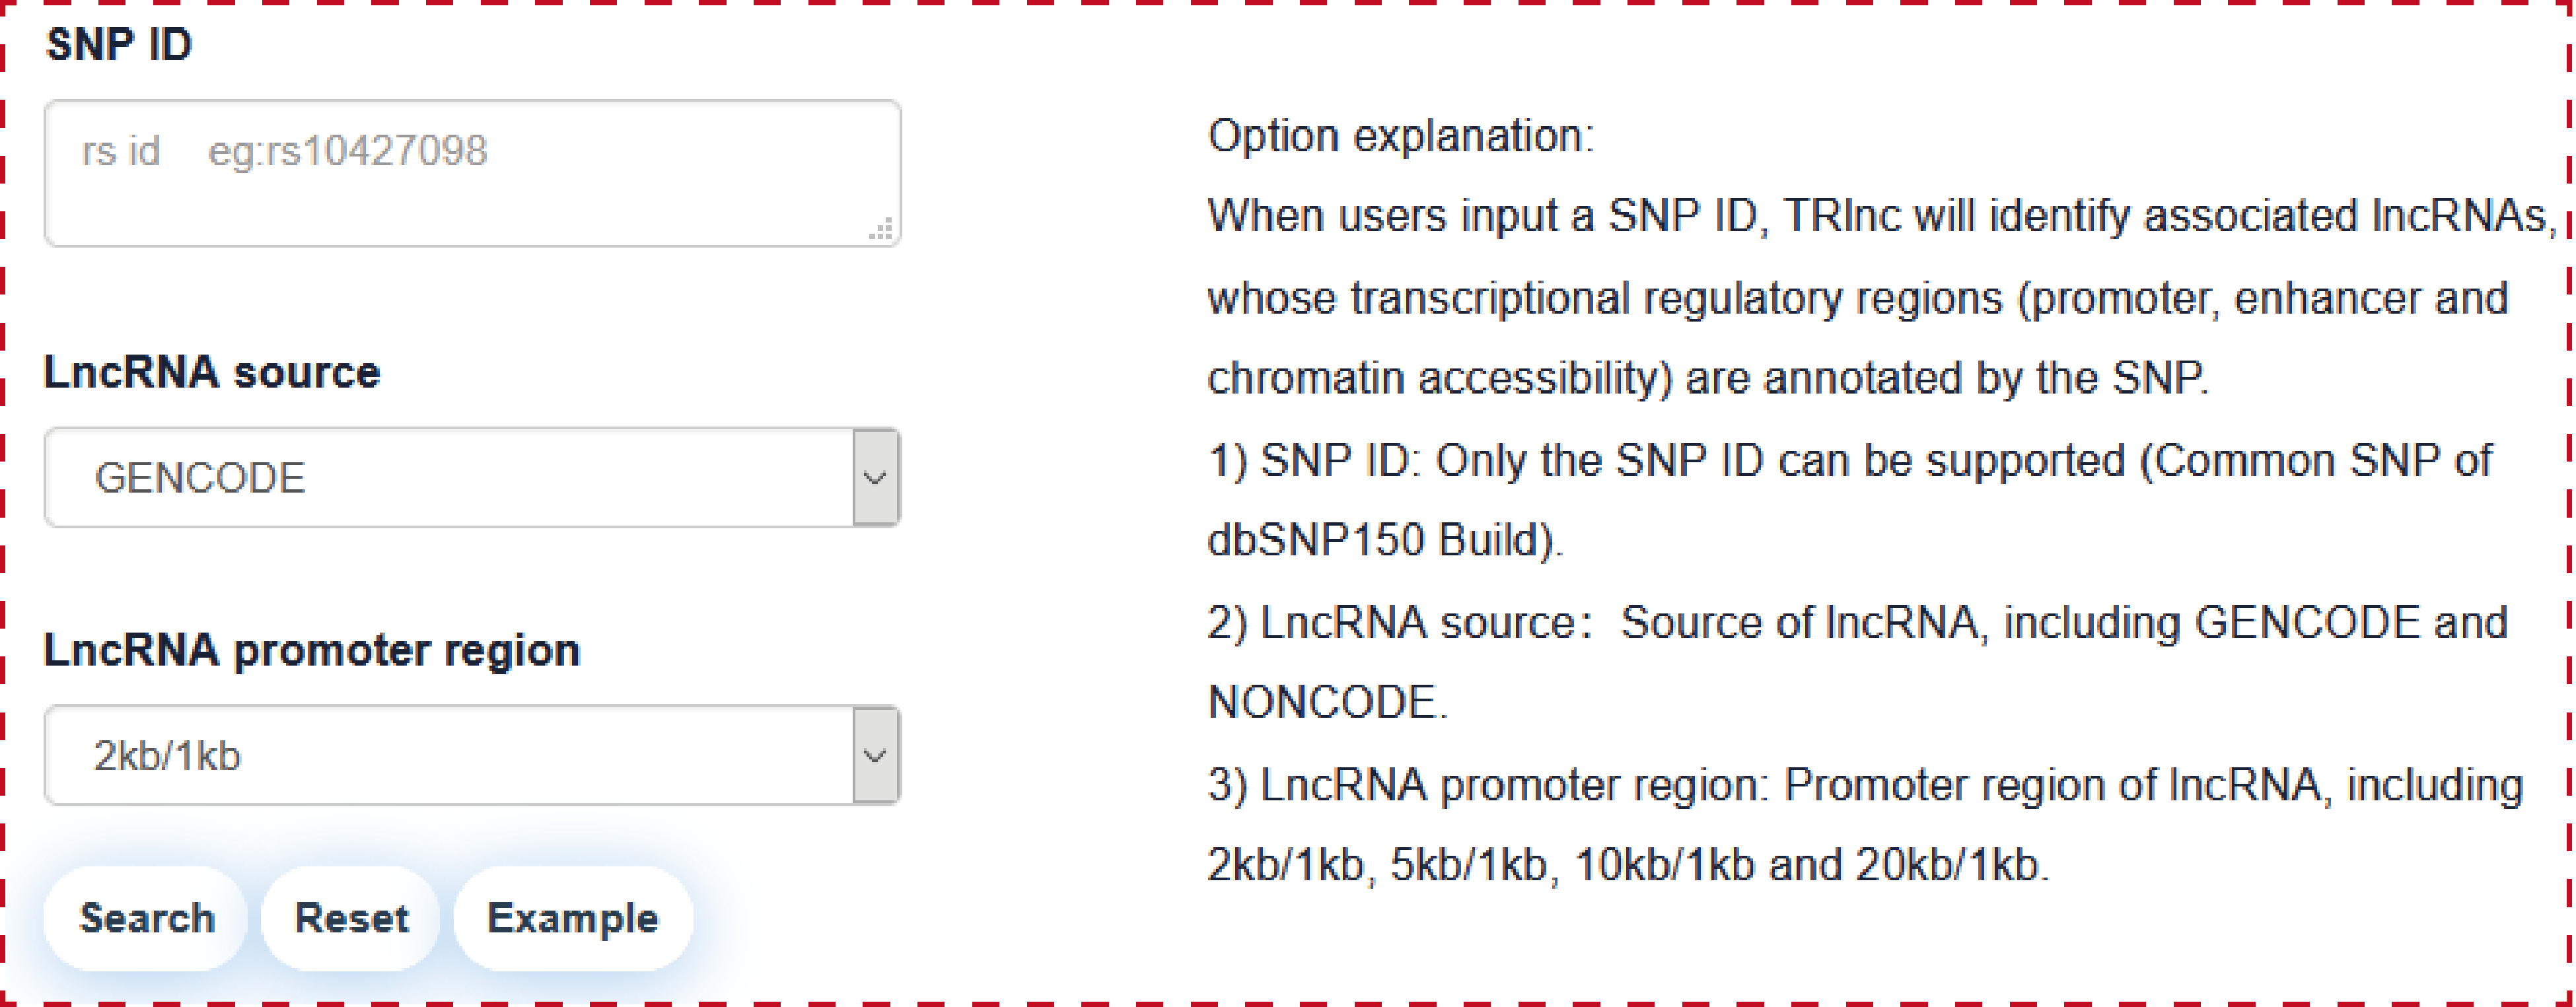
Users can query by inputing SNP ID, lncRNA source and lncRNA promoter region, the search result will be displayed on the next page.
The ‘search result’ page shows SNP general information, the network of SNP associated lncRNAs and the statistics of lncRNA associated regulatory regions.
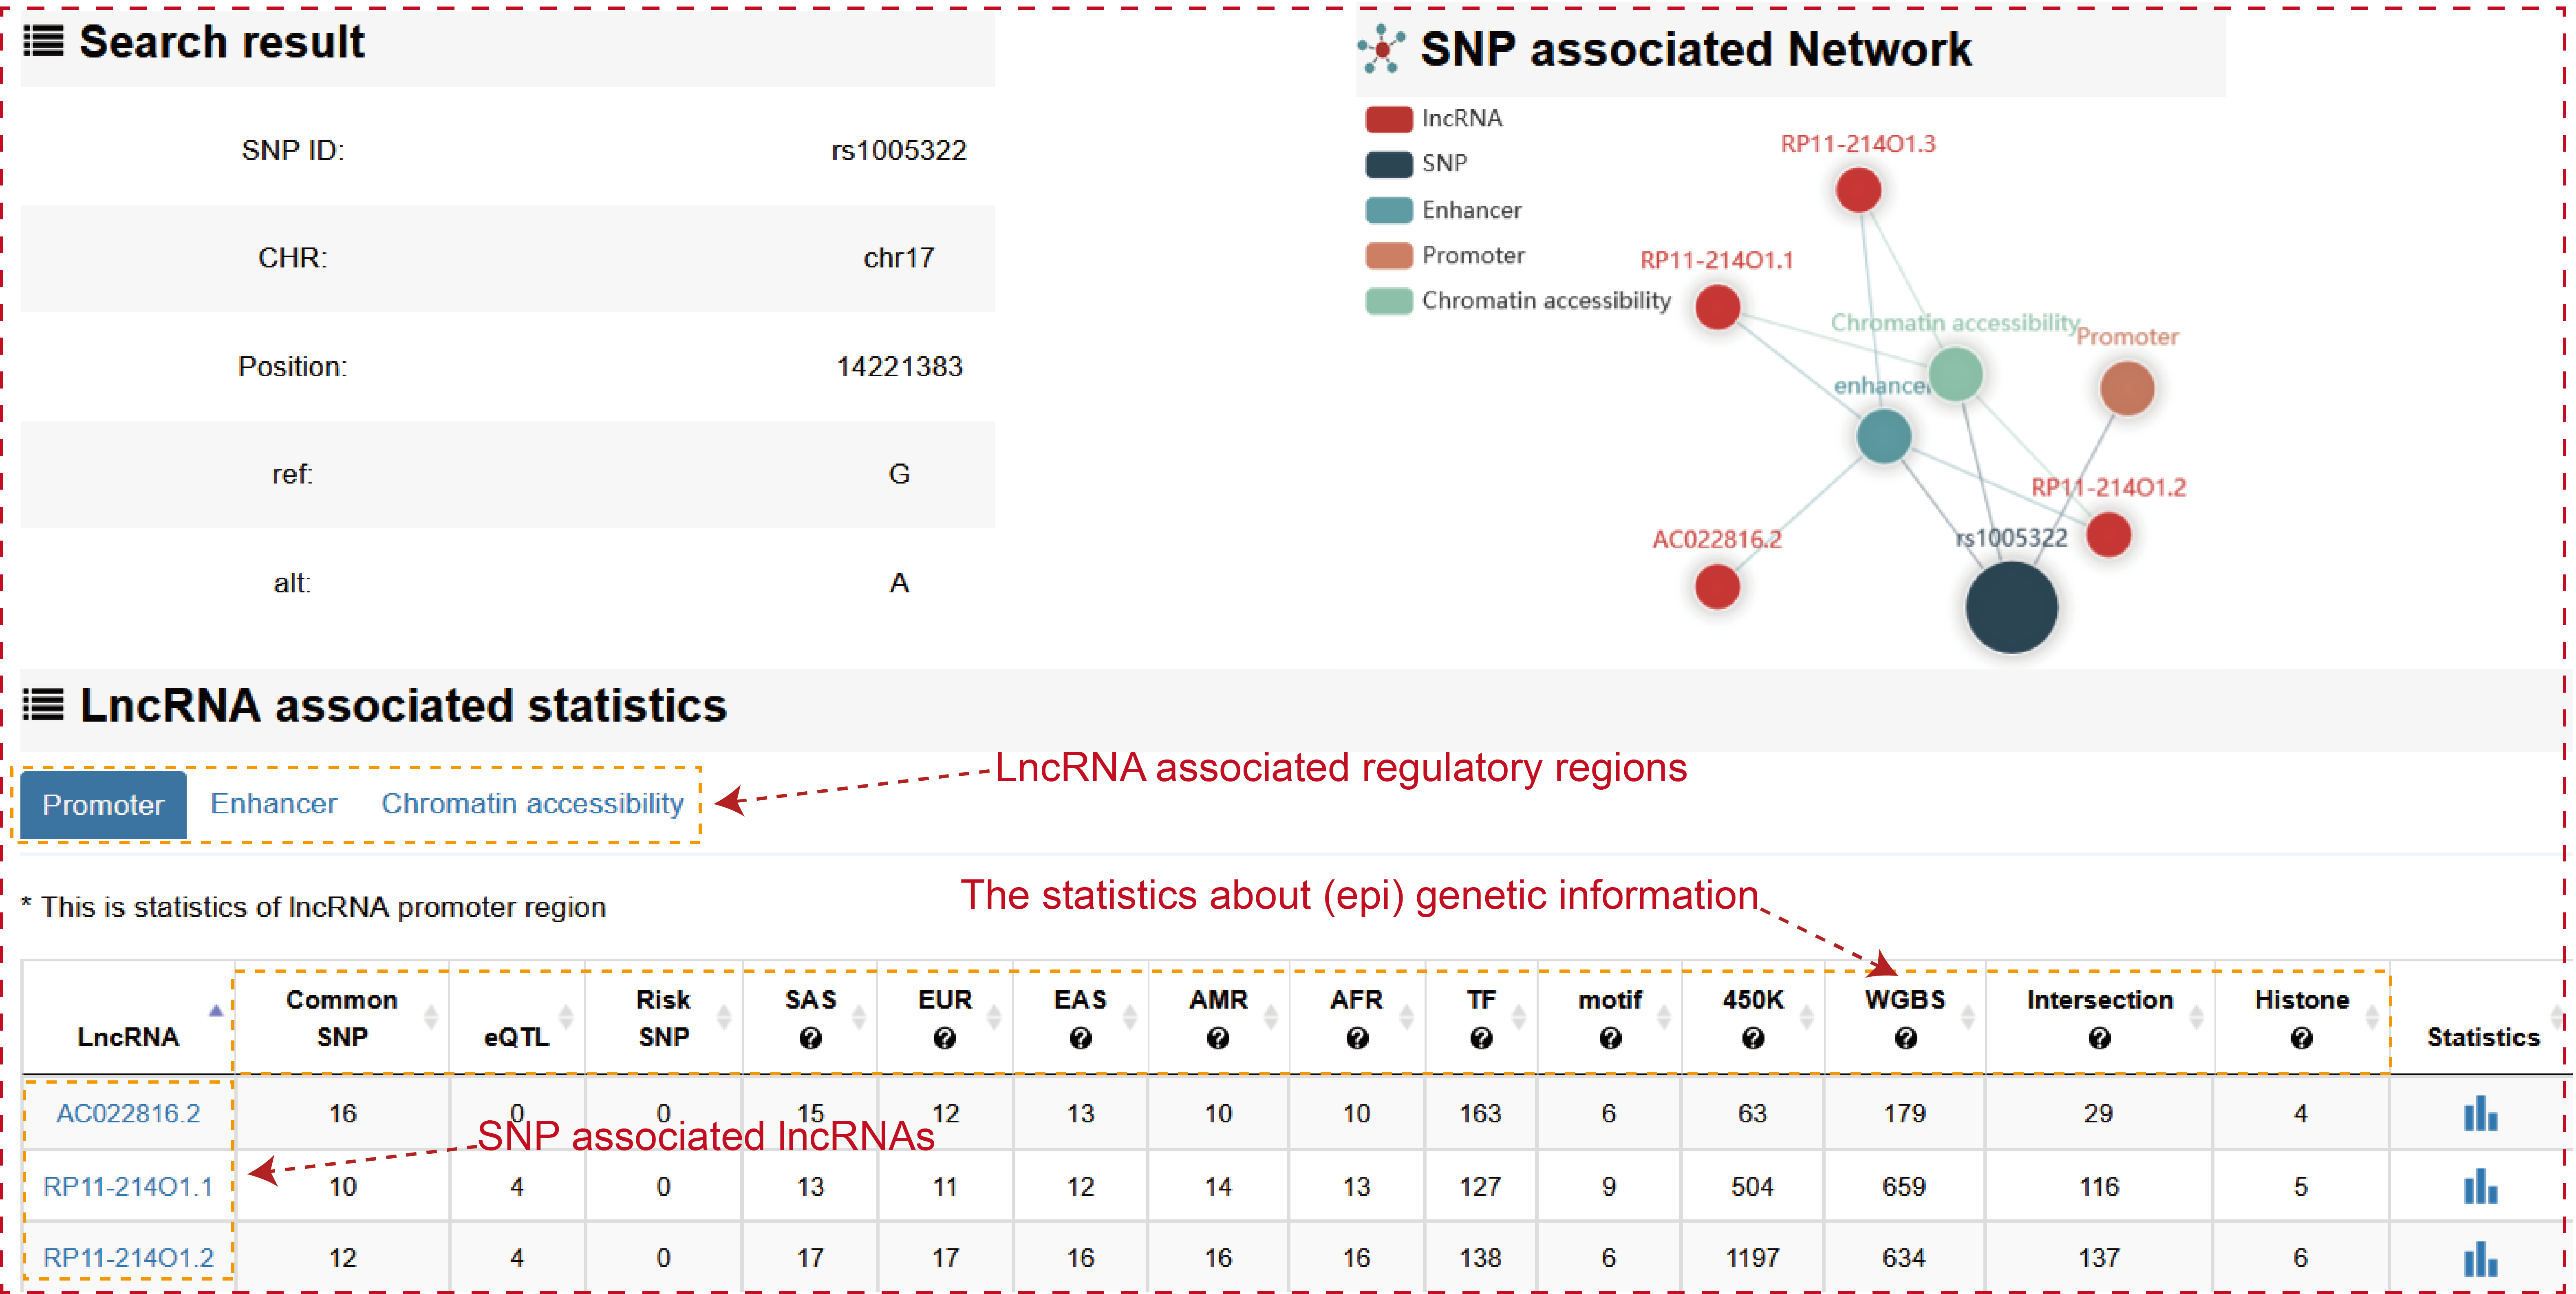
Users can click ‘LncRNA name’ of the table to view the details about each lncRNA.
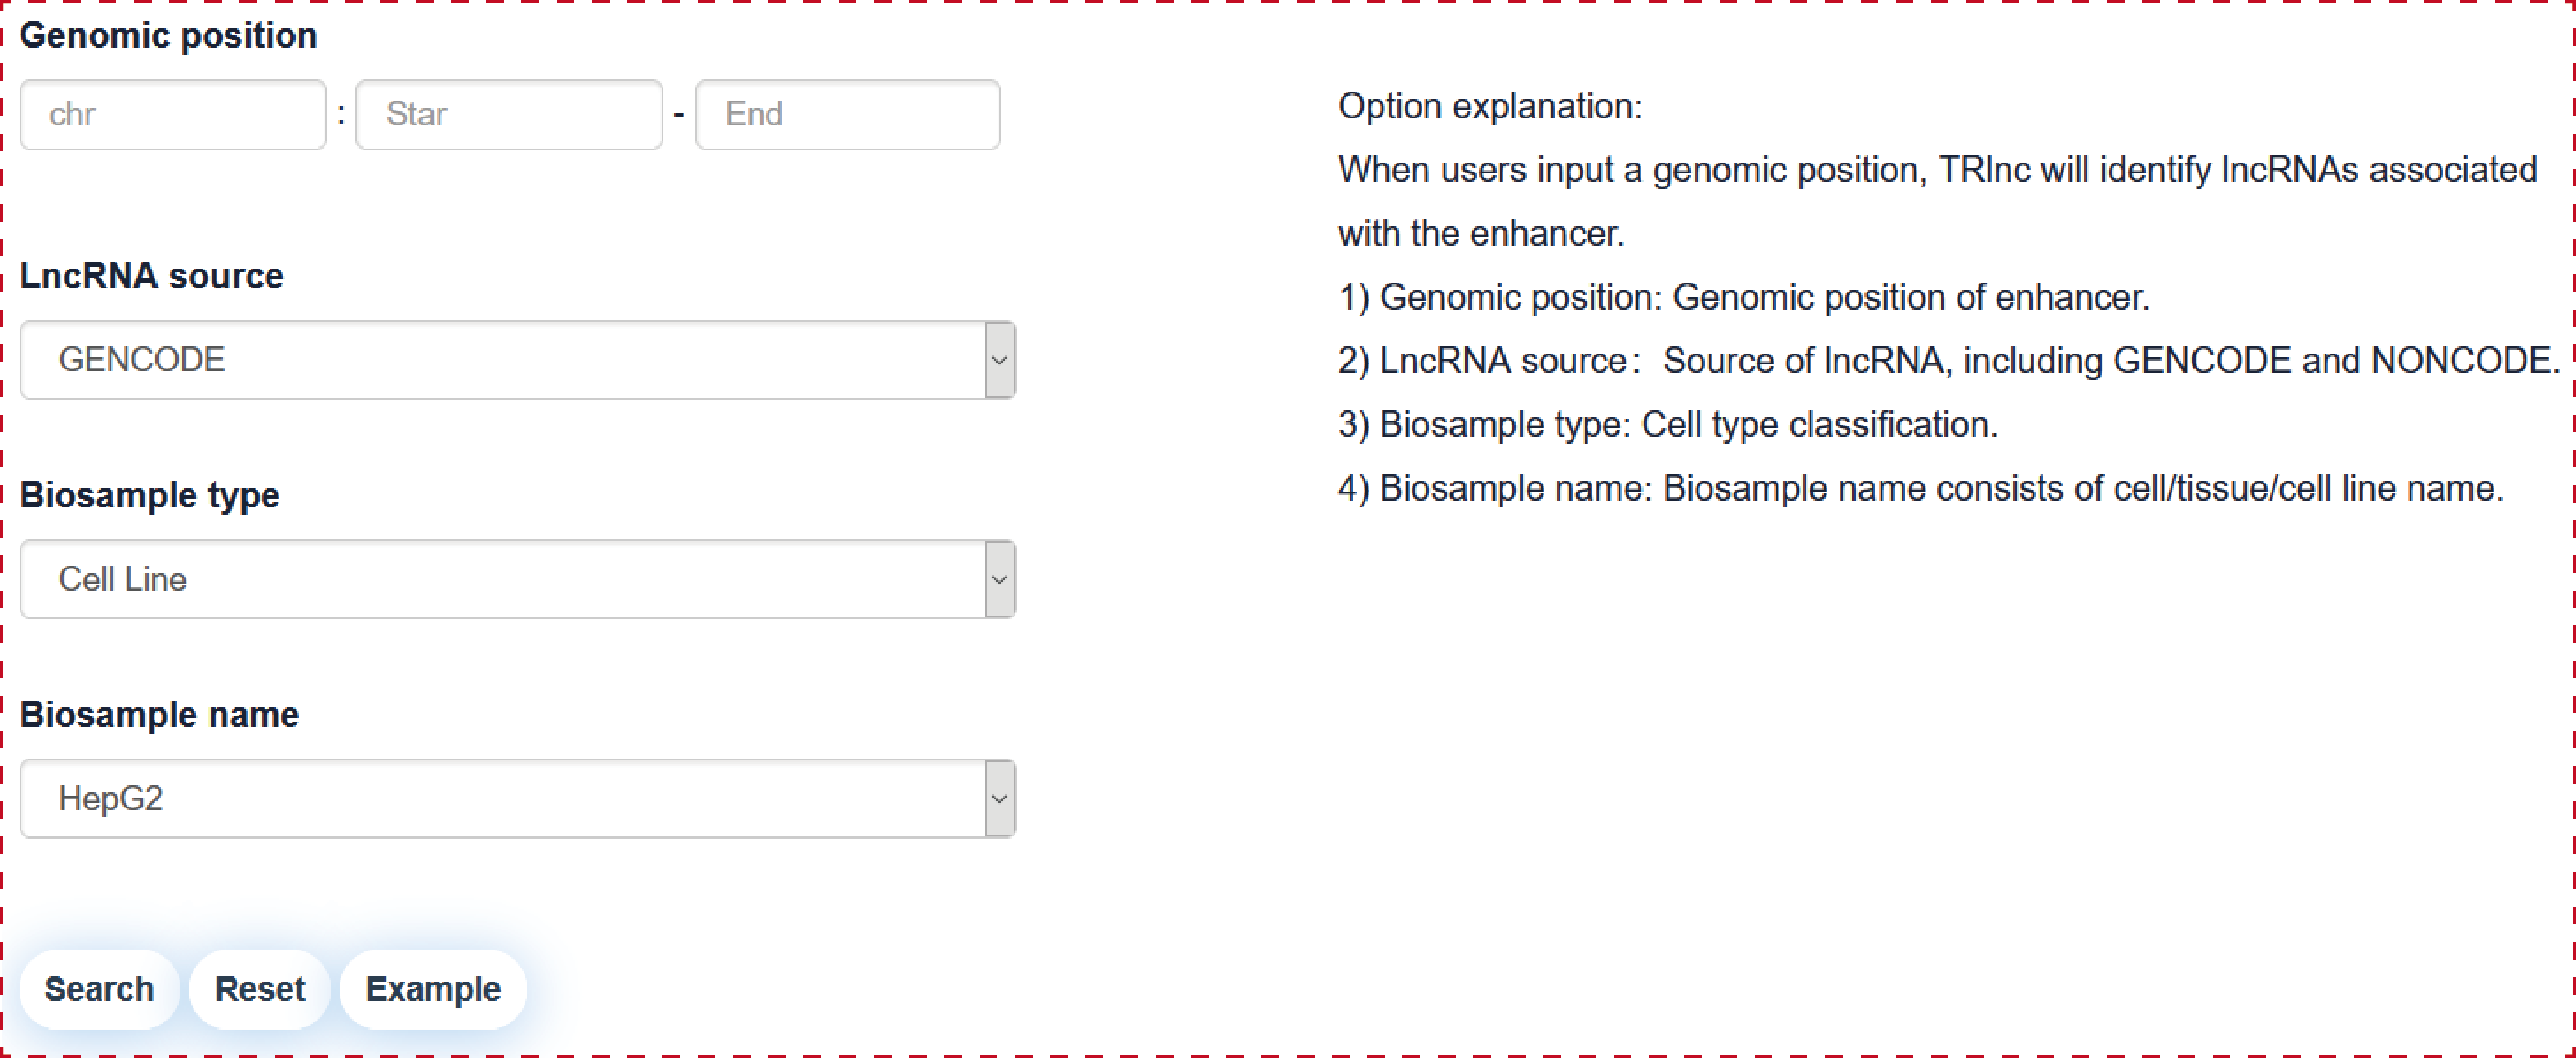
Users can query by inputing a genomic position of enhancer, lncRNA source, Biosample type and Biosample name, the search result will be displayed on the next page.
The ‘search result’ page shows enhancer general information, the network of enhancer associated lncRNAs, and the statistics of lncRNA associated regulatory regions.
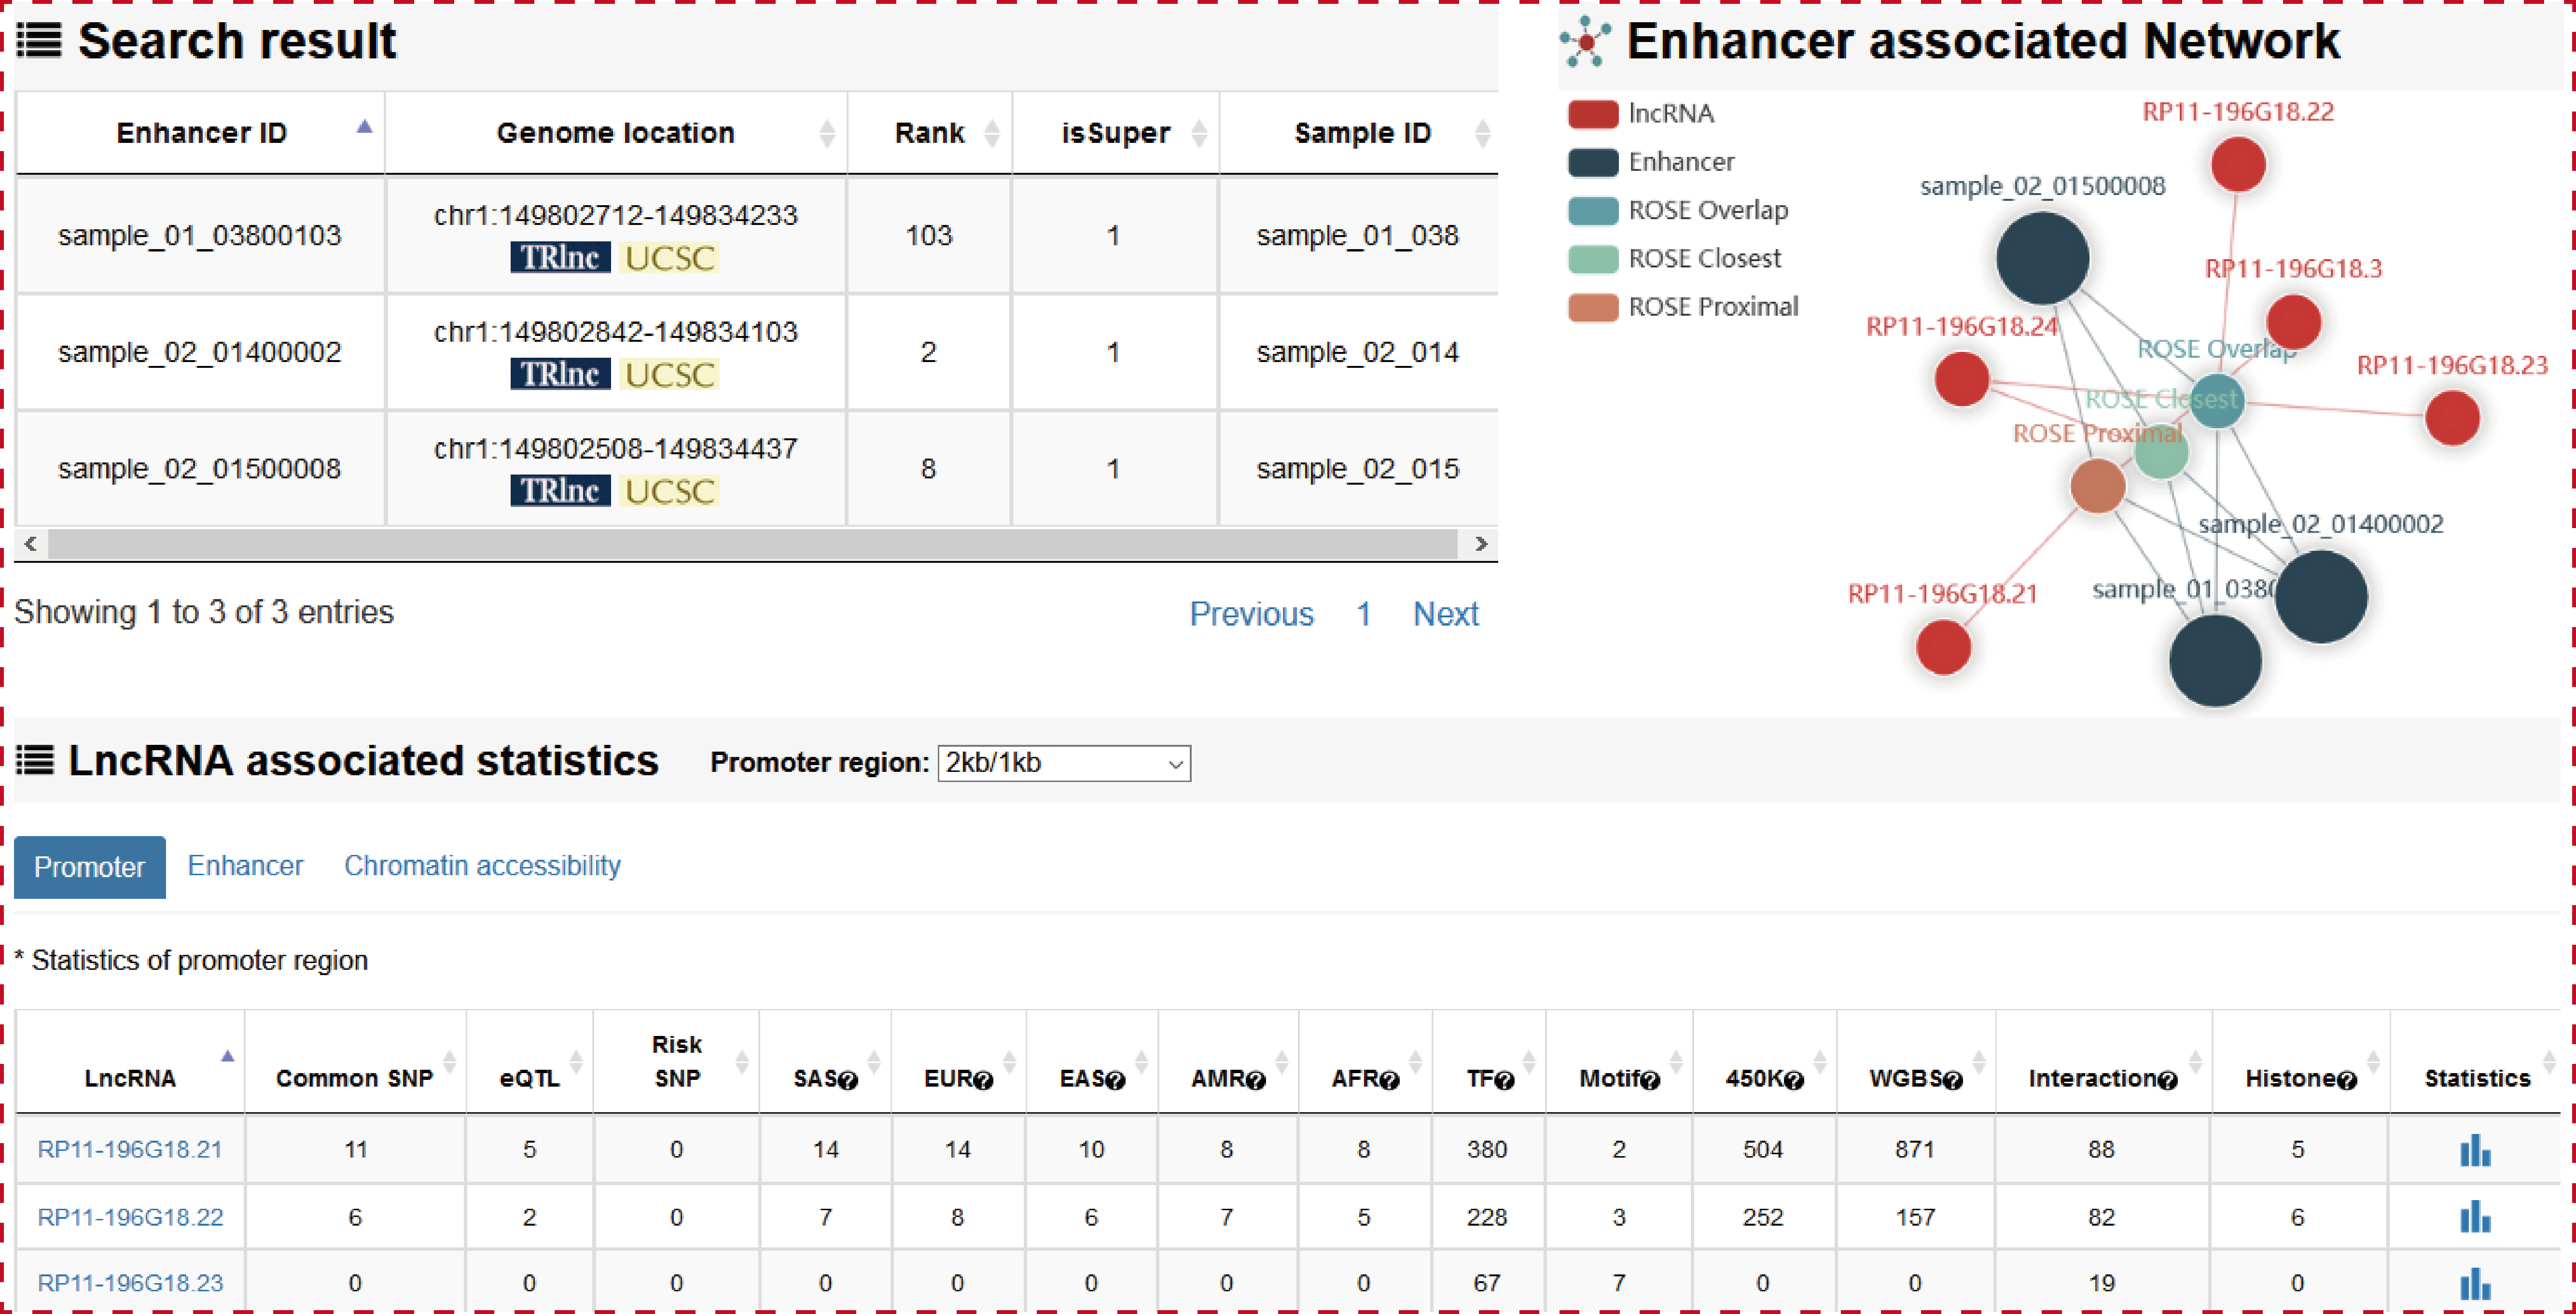
Users can click ‘LncRNA name’ of the table to view the details about each lncRNA.
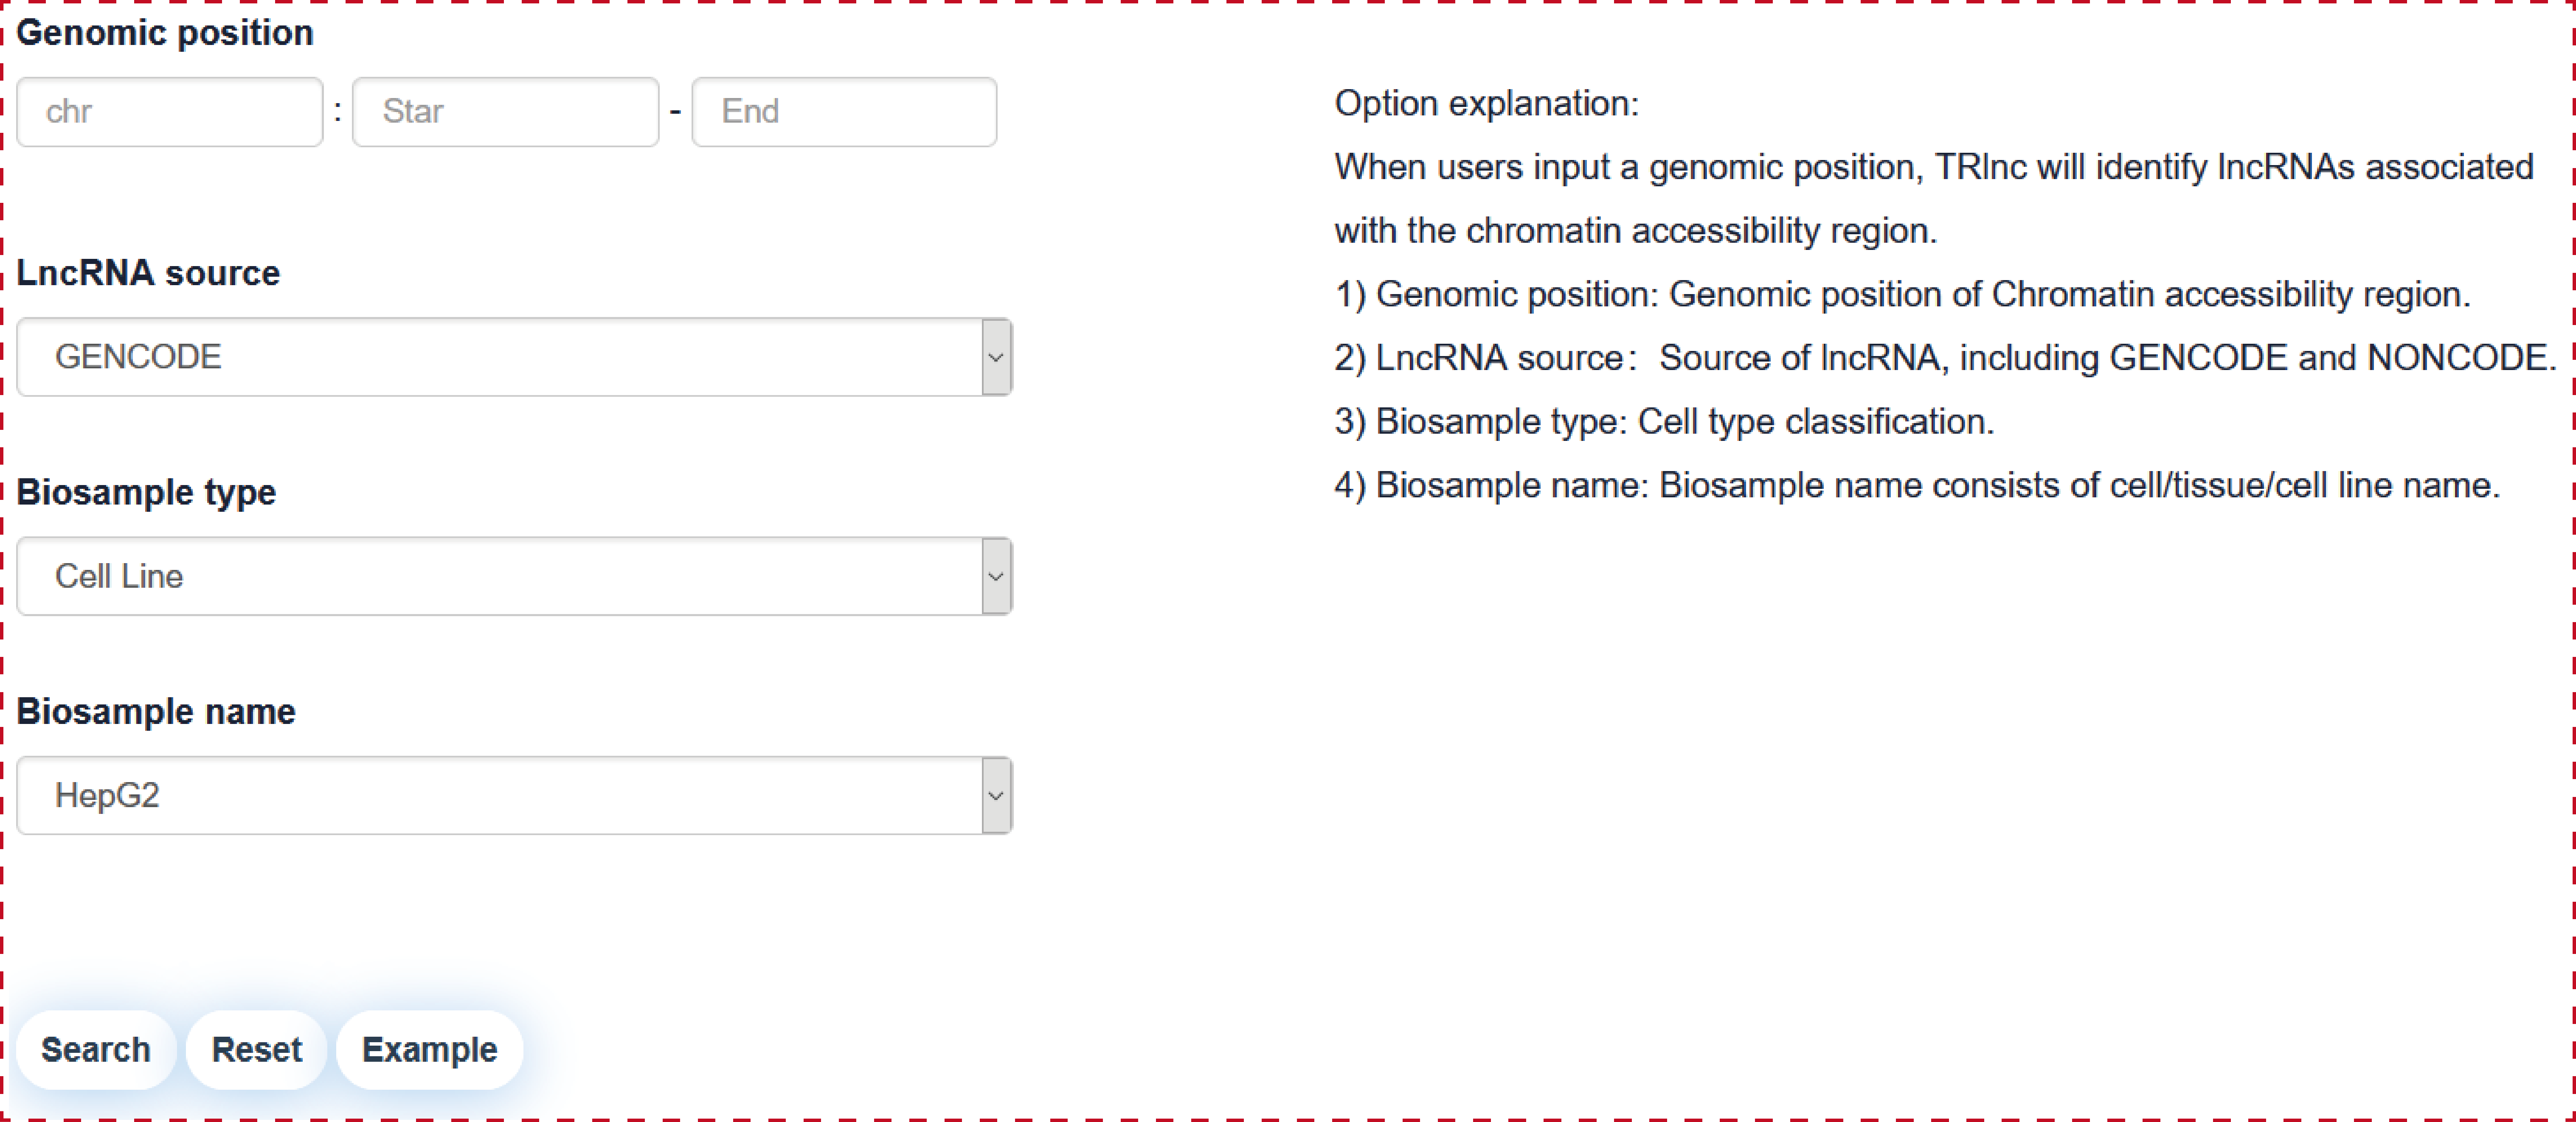
Users can query by inputing a genomic position of chromatin accessibility region, lncRNA source, Biosample type and Biosample name, the search result will be displayed on the next page.
The ‘search result’ page shows chromatin accessibility region general information, the network of chromatin accessibility region associated lncRNAs and the statistics of lncRNA associated regulatory regions.
Users can click ‘LncRNA name’ of the table to view the details about each lncRNA.
3. How to use the "Analysis"?
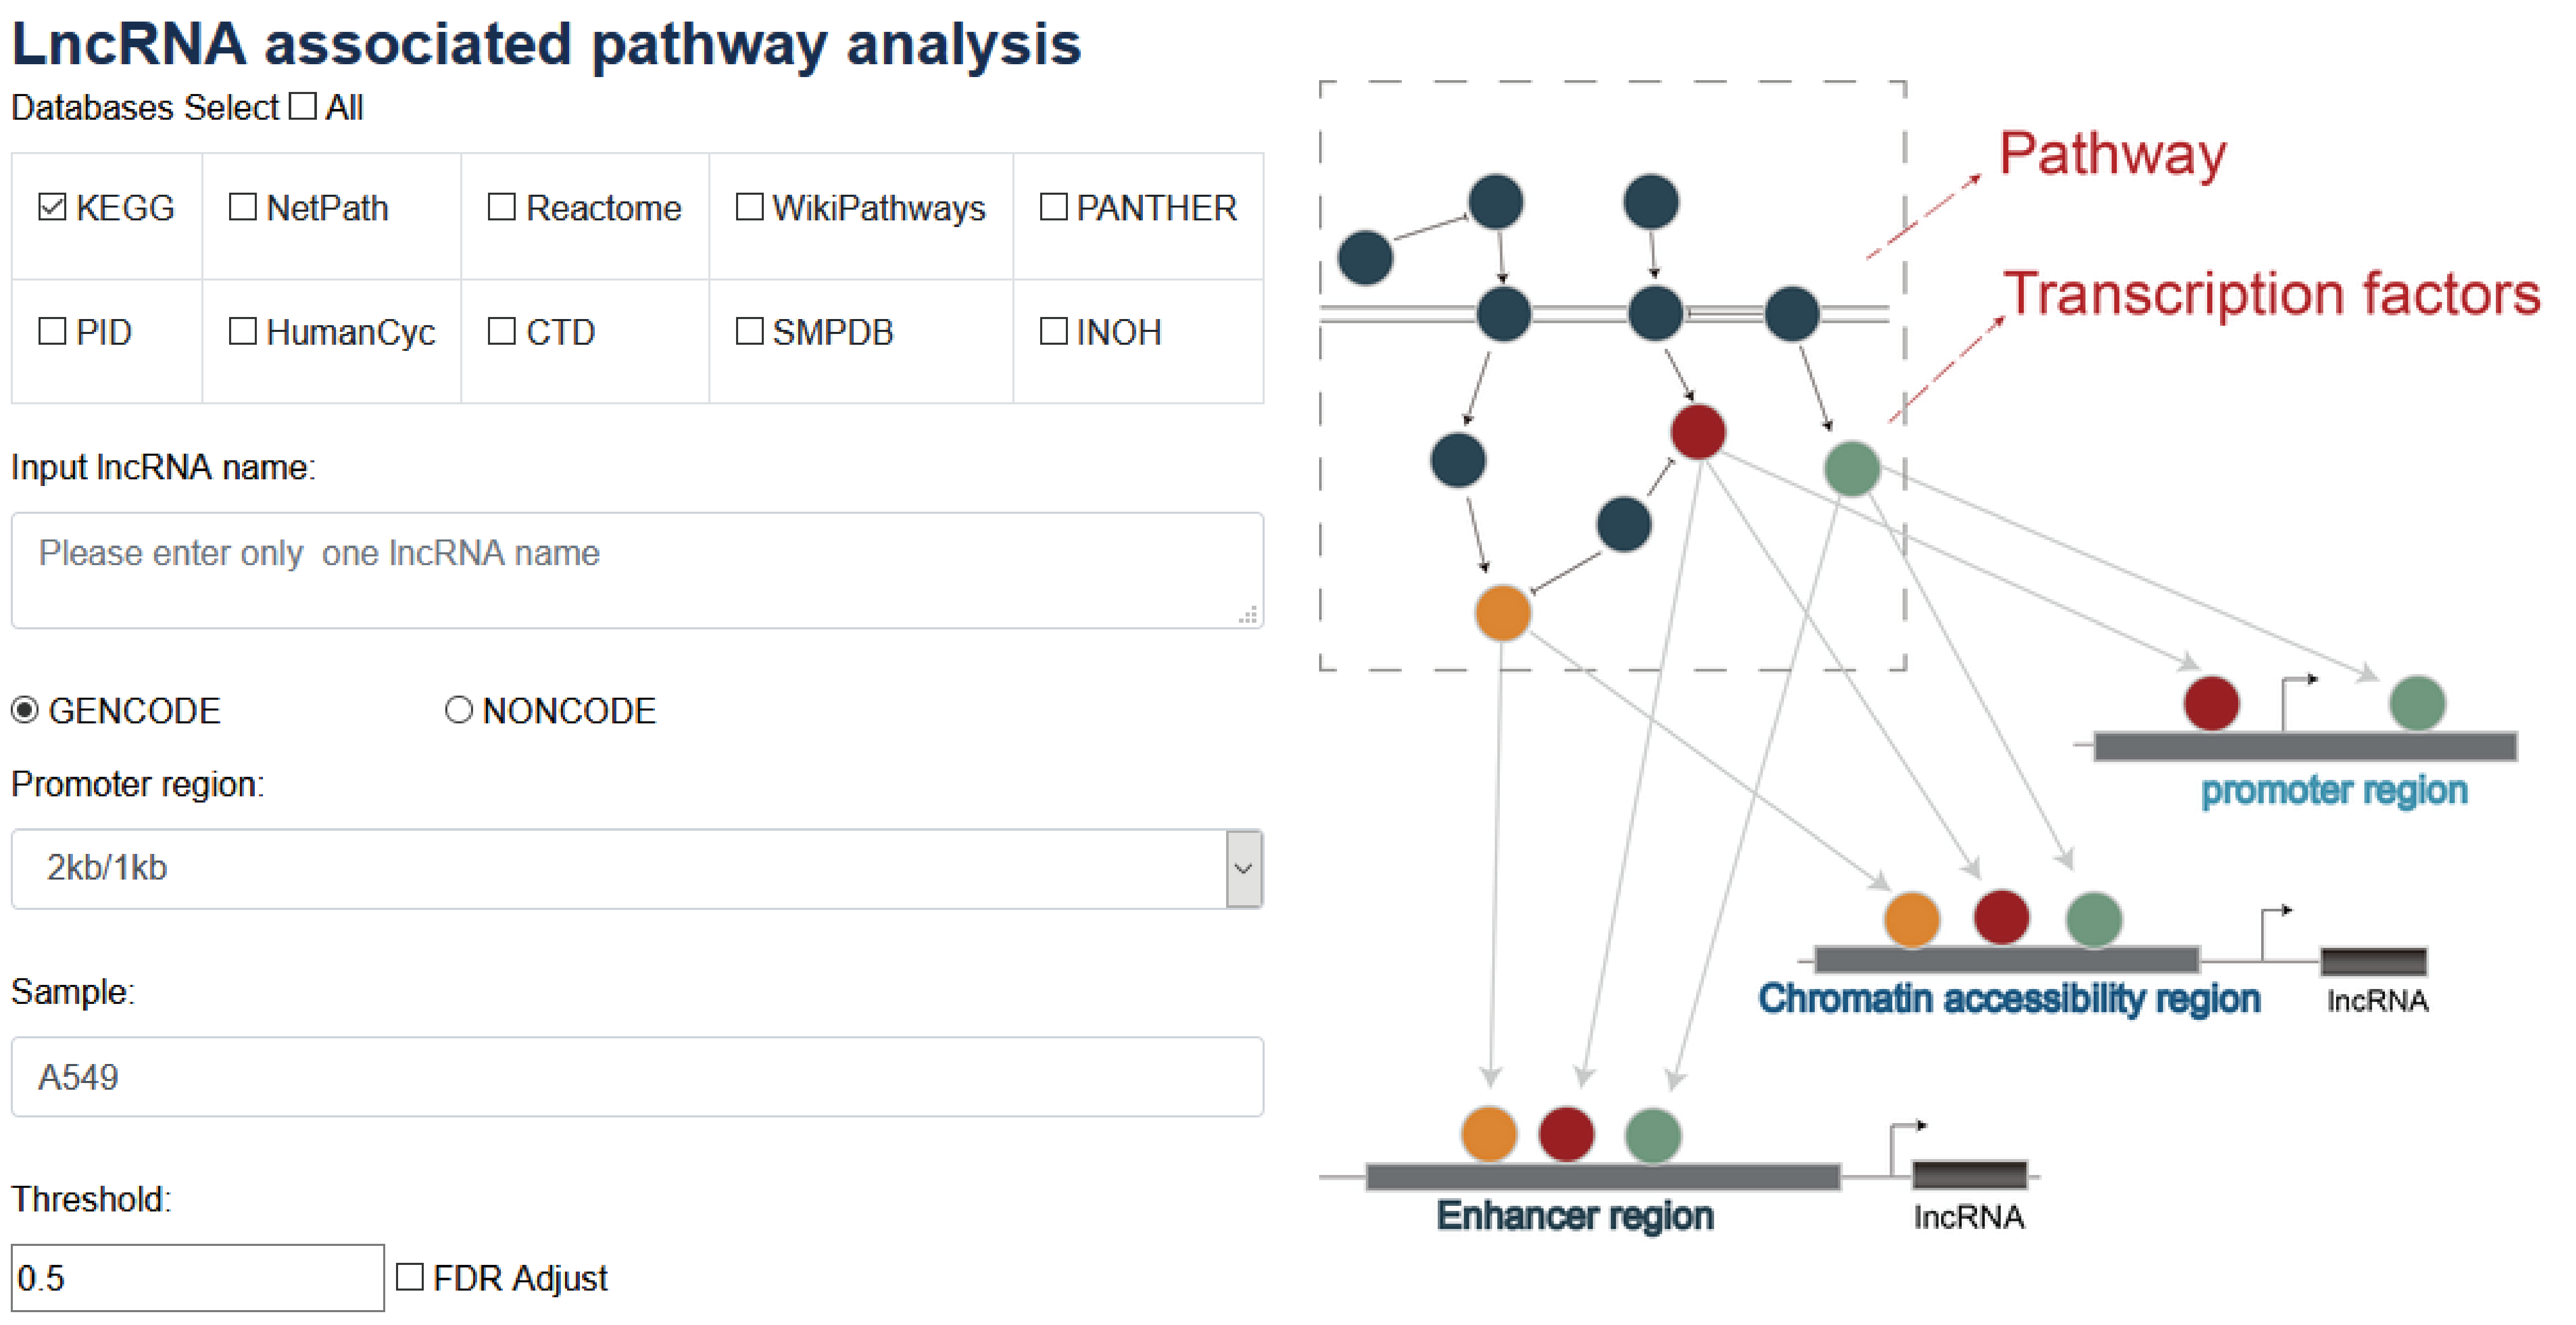
When user input a lncRNA, promoter region, sample of TF ChIP-seq, P-value, FDRs and the selection of at least one pathway database (e.g. KEGG), According to TFs binding to the lncRNA. Then, the enriched pathways associated with the lncRNA are calculated using hypergeometric test based on TFs binding to the lncRNA.
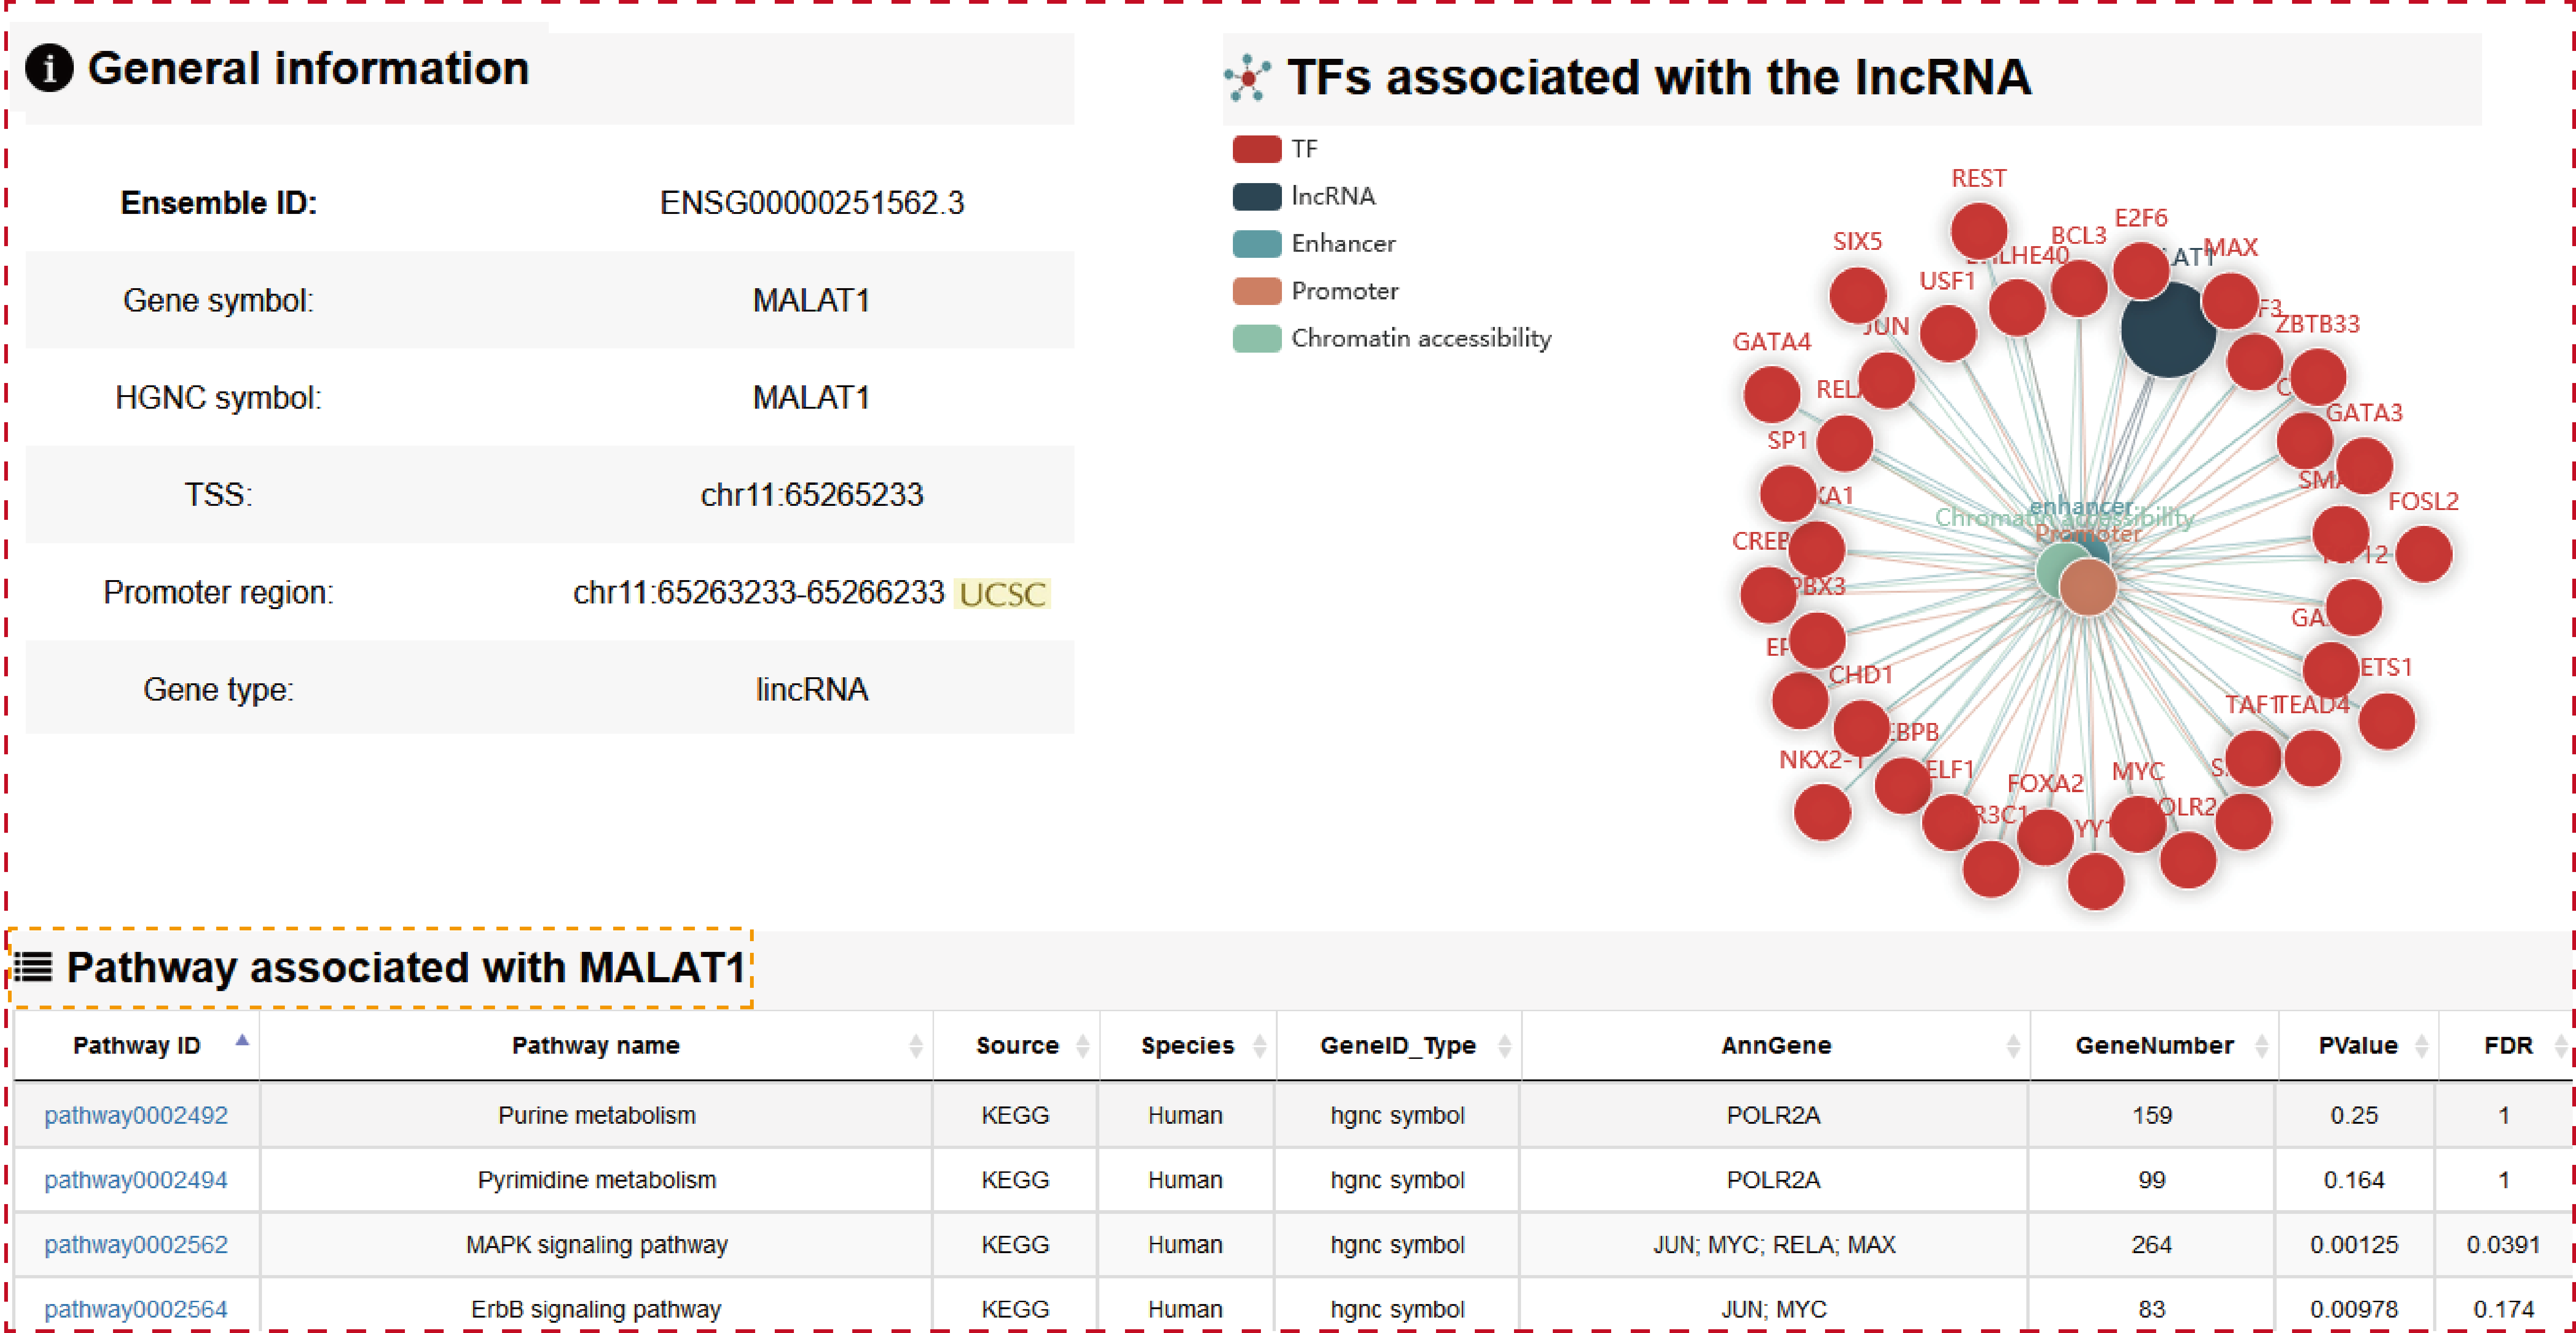
The ‘search result’ page shows TF general information, the statistics of detailed and the network of TF associated lncRNAs in cell type-specific manner, the output table describes the pathway basic information (Pathway ID, Pathway name, Pathway source, Annotated gene, Annotated gene number, Total gene number, The terminal TF and TF number), enrichment score P-value and FDR.
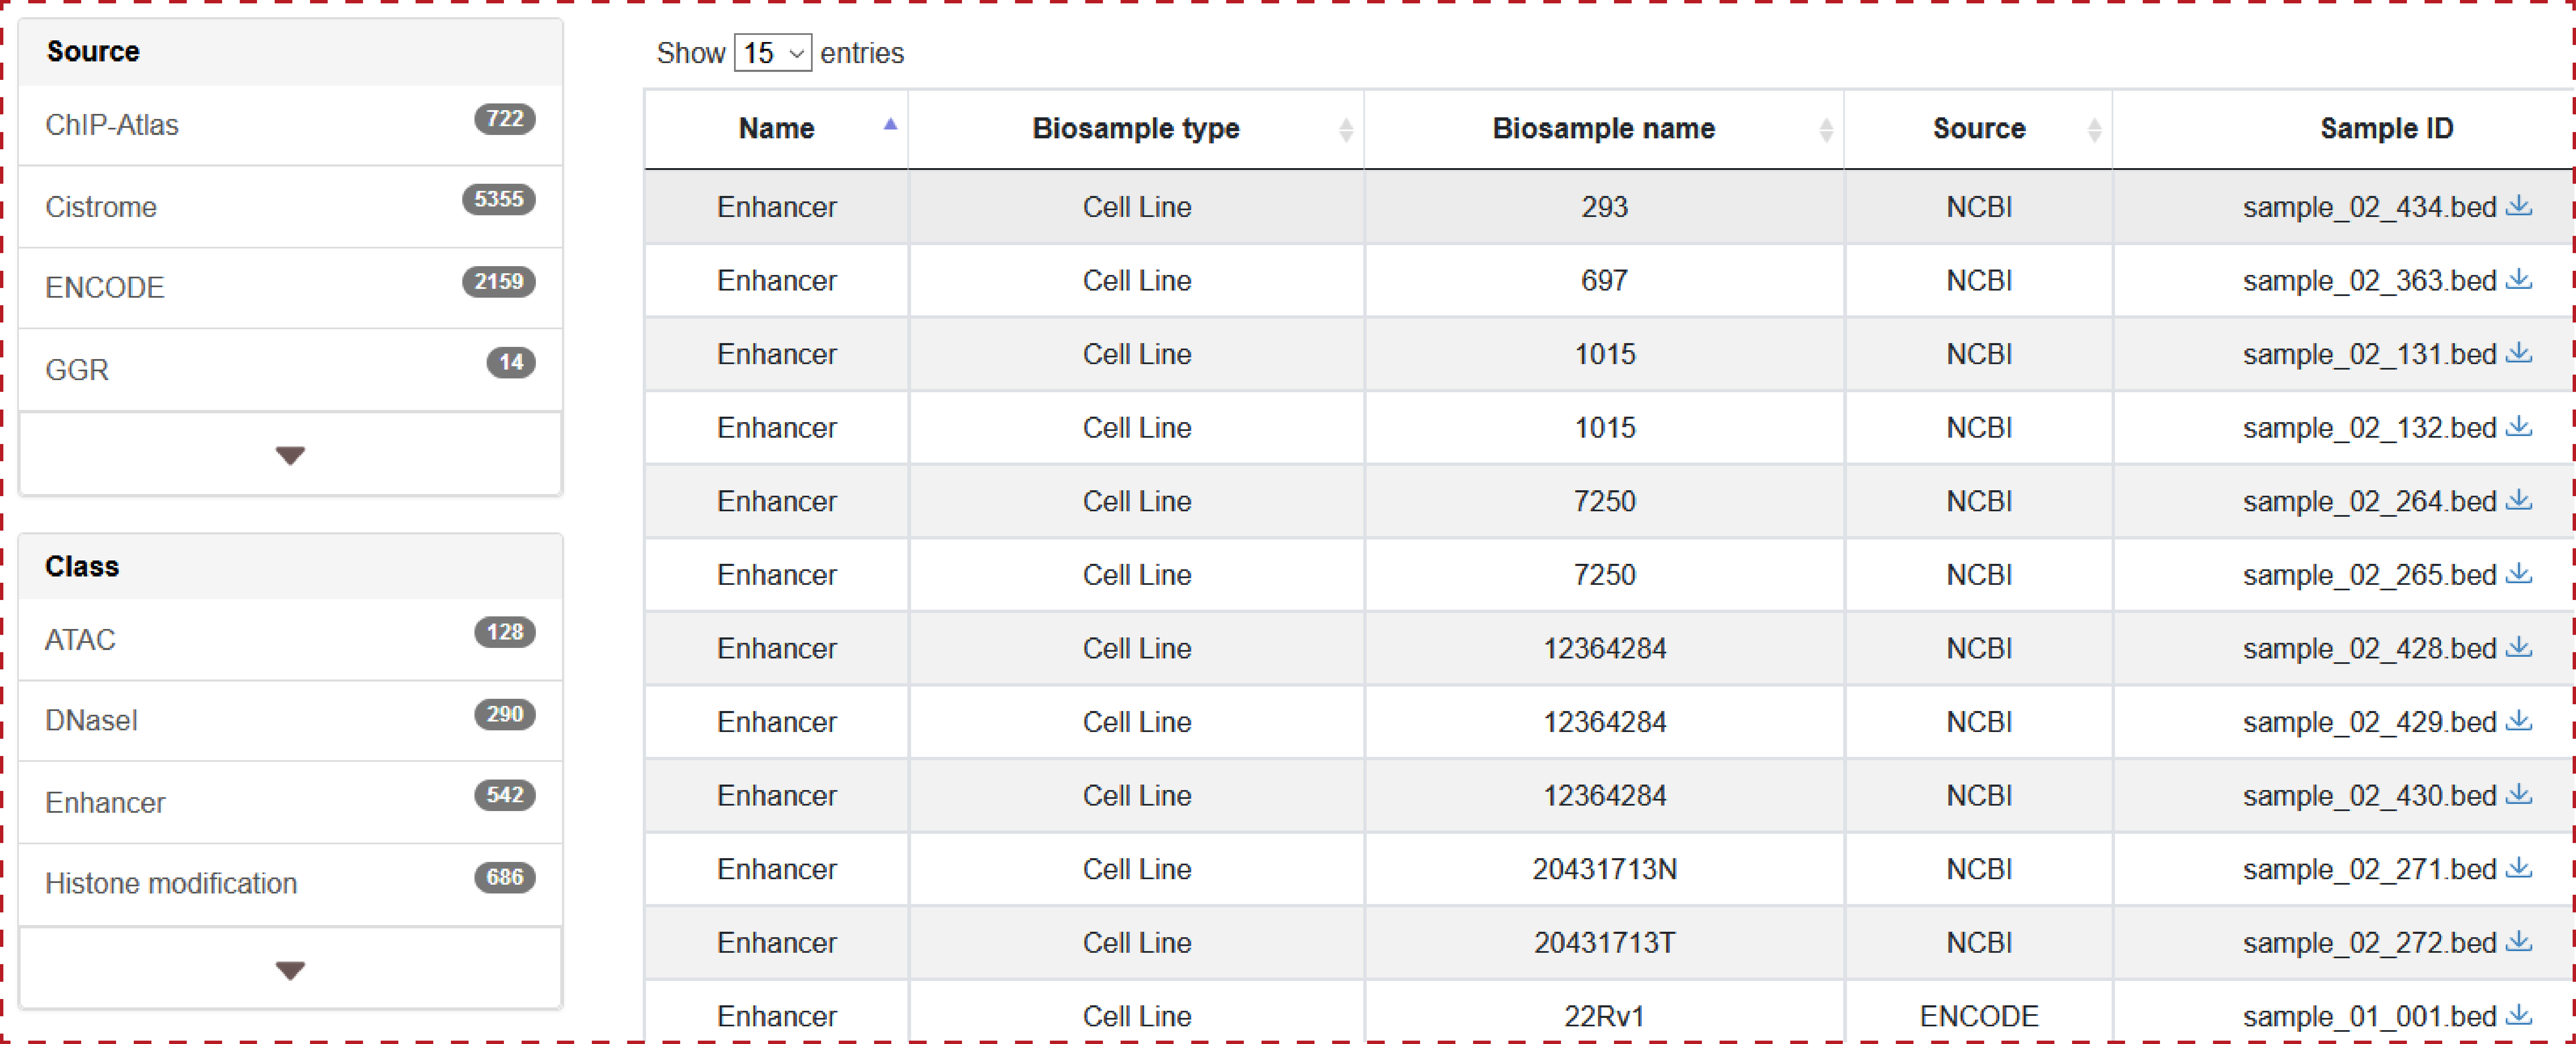
4. Browse
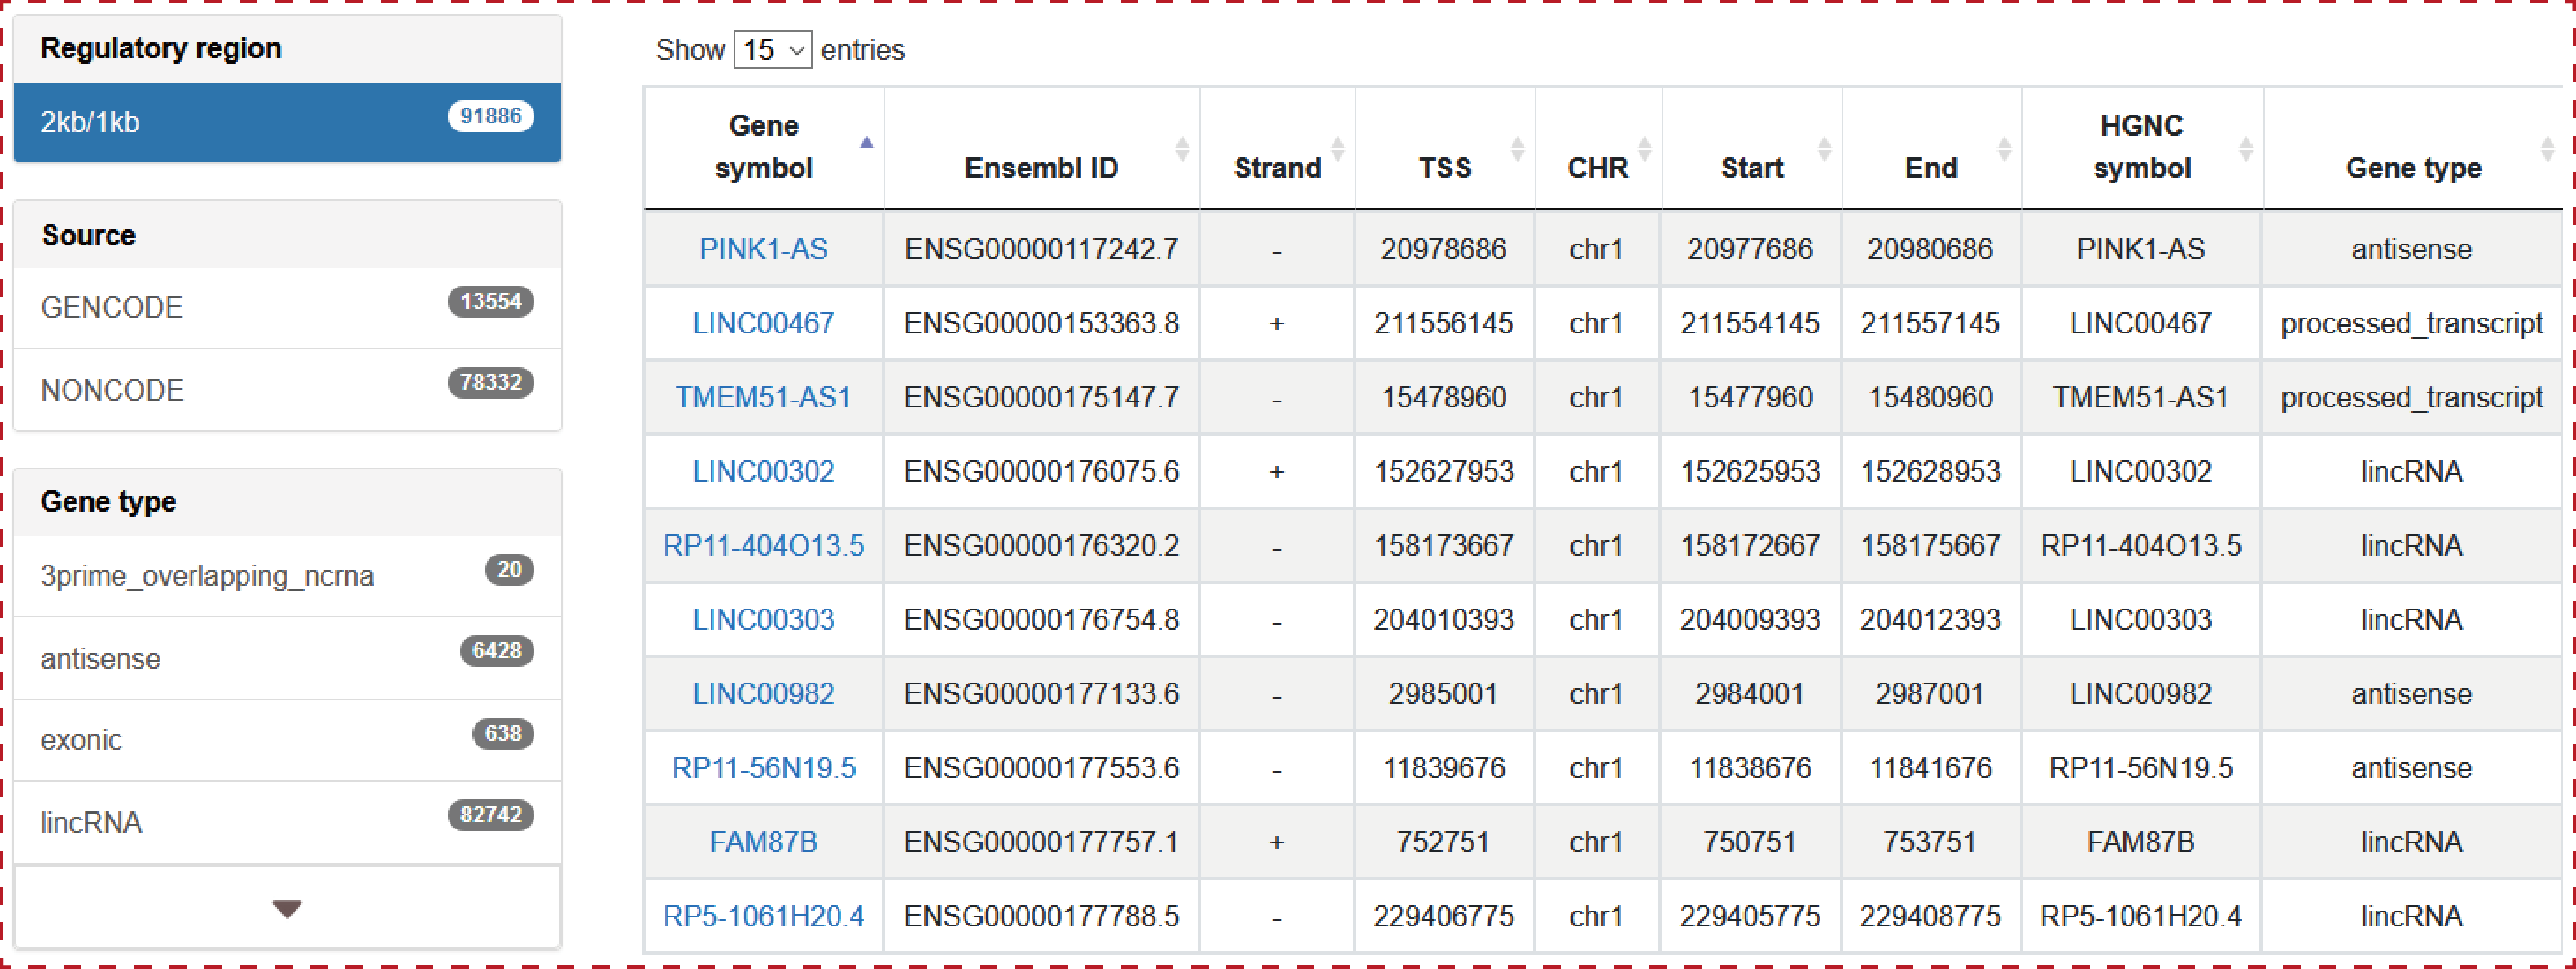
The ‘Browse’ page is organized as an interactive and alphanumerically sortable table. Users can quickly search lncRNAs and customize filters by selecting ‘Source’, ‘Gene type’, ‘Promoter region’ and ‘CHR’ in the interactive table. The ‘Show entries’ drop-down menu are provided for conveniently changing the number of records per page. To view the detailed transcriptional regulatory information for a given lncRNA, users only need to click on the ‘lncRNA name’.
5. Visualization
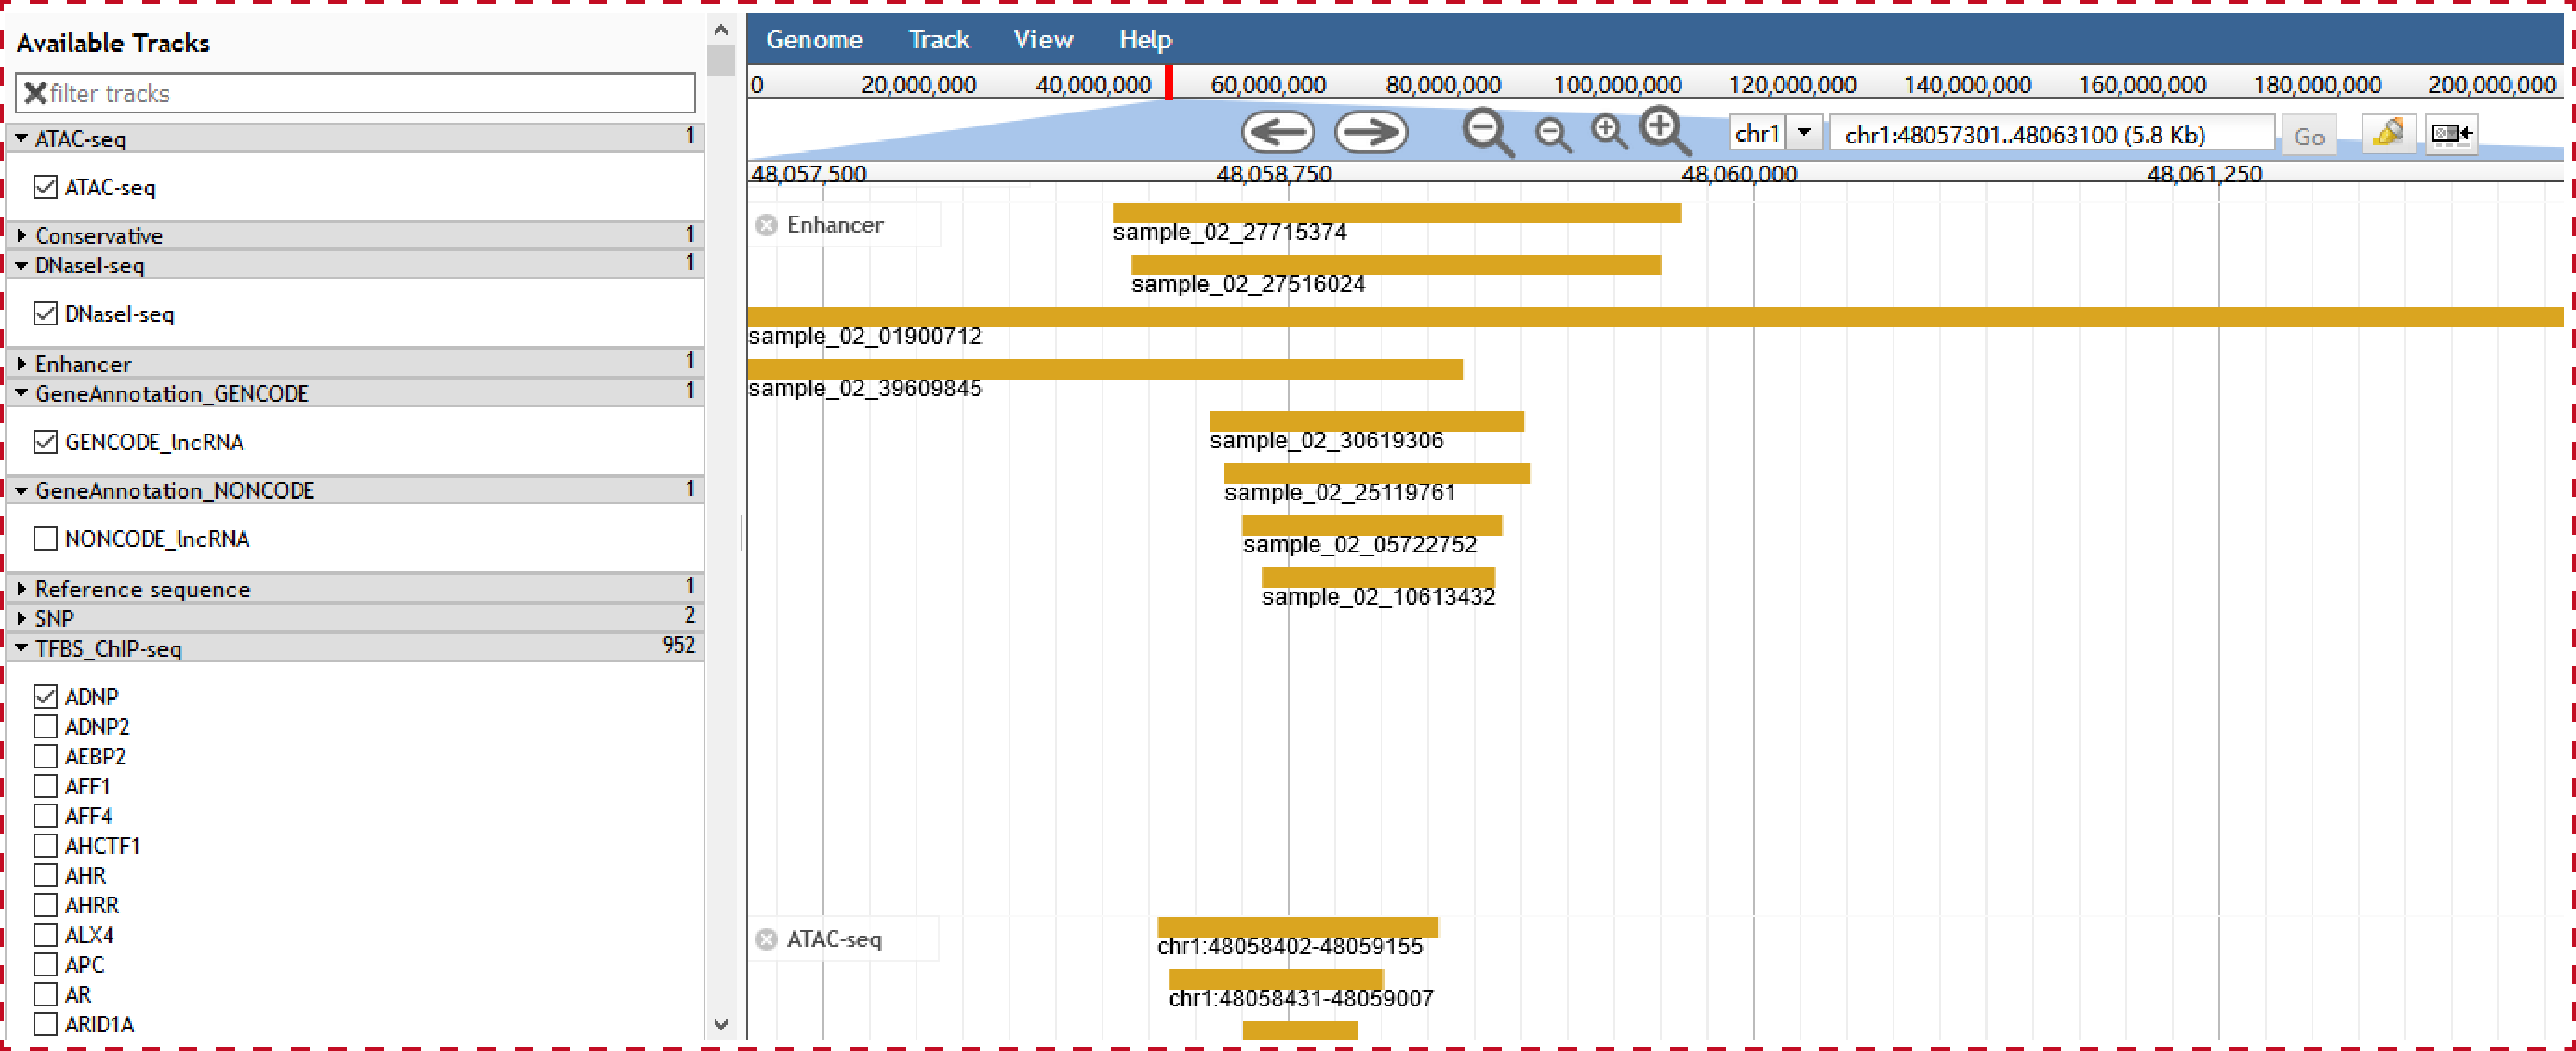
In order to help users to intuitively view transcriptional regulatory information of lncRNAs in the genome, we developed a personalized genome browser using JBrowse and added a lot of useful tracks. For the visualization of chromatin interaction, we developed a personalized genome browser using GIVE.

6. Download
The ‘Download’ page is organized as an interactive and alphanumerically sortable table. Users can quickly search and download the file of interest.